- Title
-
Antiviral Drug Ganciclovir Is a Potent Inhibitor of the Proliferation of Müller Glia-Derived Progenitors During Zebrafish Retinal Regeneration
- Authors
- Zhang, S., Mu, Z., He, C., Zhou, M., Liu, D., Zhao, X.F., Goldman, D., Xu, H.
- Source
- Full text @ Invest. Ophthalmol. Vis. Sci.
|
Ganciclovir treatment significantly reduced the number of MGPCs after retinal injury. (A) Green fluorescent protein (green) and BrdU (red) immunofluorescence shows that GCV treatment decreased the number of BrdU+ MGPCs localized to the injury site at 4 dpi. DAPI (42,6-diamidino-2-phenylindole) channel (blue) was added to the overlay images to show retinal layer structures. Tg(1016tuba1a:GFP) fish received a pulse of BrdU 3 hours before they were killed at 4 dpi. (B) Quantification of BrdU+ MGPCs in (A). *P < 0.05; **P < 0.01 compared to PBS control, n = 4. (C) TUNEL staining and quantification of TUNEL+ cell numbers from PBS-, GCV-, or ouabain-treated retina at 3 dpi. Arrows mark TUNEL+ cells. #No significant difference, P > 0.05, n = 4. Scale bars: 100 µm. The asterisks mark the injury site (needle poke). ONL, outer nuclear layer; INL, inner nuclear layer; GCL, ganglion cell layer; dpi, days post injury; MGPCs, Müller glia-derived progenitor cells. |
|
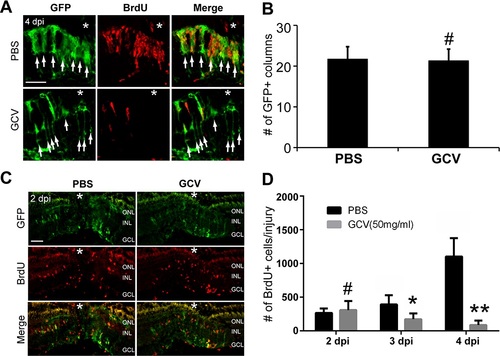
Ganciclovir had no effect on Müller glia dedifferentiation and the initial MGPC formation. (A) Confocal microscopy of retinal sections after GFP and BrdU immunofluorescence shows the presence of GFP+ Müller glia near injury site in PBS- or GCV-treated retina at 4 dpi. Tg(1016tuba1a:GFP) fish were given a pulse of BrdU 3 hours before they were killed at 4 dpi. Note that there are many fewer BrdU+ MGPCs in GCV-treated retina than in control. Arrows indicate GFP+ columns. Each GFP+ column represents an activated Müller glia and its daughter progenitor cells. (B) Quantification of the number of GFP+ columns at the injury site at 4 dpi. #No significant difference, P > 0.05, n = 4. (C) Immunofluorescence shows the initial formation of MGPCs in the INL in PBS- or GCV-treated retina at 2 dpi. Tg(1016tuba1a:GFP) fish received a pulse of BrdU 3 hours before they were killed at 2 dpi. (D) Quantification of the number of BrdU+ MGPCs per injury at 2, 3, and 4 dpi in PBS- or GCV-treated retina. Fish received a pulse of BrdU 3 hours prior to killing at 2, 3, or 4 dpi. #No significant difference, P > 0.05; *P < 0.05; **P < 0.01. n = 4 for each group. Scale bars: 50 µm. The asterisks mark the injury site (needle poke). |
|
Ganciclovir inhibits MGPC proliferation. (A) Schematic illustration showing the experimental timeline. Retinas of wild-type zebrafish were injured, and all fish received a pulse of BrdU at 45 hpi. Fish then received intravitreous PBS or GCV injection once daily until 4 dpi. Retinas were collected at indicated time points (48, 72, and 96 hpi). (B) Bromodeoxyuridine immunofluorescence showing that GCV inhibits the expansion of MGPCs in the retina. Bromodeoxyuridine signals are shown in green. (C) Quantification of (B). *P < 0.05 compared to PBS-treated control. n = 3 for each group. Scale bars: 100 µm. The asterisks mark the injury site (needle poke). |
|
Ganciclovir treatment had no effect on microglia accumulation at the injury site. (A–D) Immunofluorescence shows the BrdU+ MGPCs (green) and IB4+ microglia (red) at the injury site at 2 and 3 dpi. Note that all the IB4+ microglia were BrdU negative. (E) Quantification of the number of microglia at the injury site at 2 and 3 dpi. The asterisks mark the injury site (needle poke). #P > 0.05 compared to PBS-treated control. n = 3 for each group. Scale bars: 100 µm. |
|
Müller glia remained in a dedifferentiated state after GCV treatment. (A) Green fluorescent protein and BrdU immunofluorescence showing the presence of strong GFP+ Müller glia at the injury site in GCV-treated retina at 8 and 12 dpi. Only very weakly GFP-expressing cells were found in the PBS-treated control. Tg(1016tuba1a:GFP) fish were given a pulse of BrdU 3 hours before they were killed at 8 or 12 dpi. (B) qPCR analysis of the expression of gfp, ascl1a, hbegfa, and socs3a in PBS- or GCV-treated retinas at 12 dpi. (C) qPCR analysis of the same genes in GCV-treated retinas at 0, 4, 8, and 12 dpi. n = 4 for each group. **P < 0.01; ***P < 0.001 compared to PBS control. Scale bars: 100 µm. The asterisks mark the injury site (needle poke). |
|
Characterization of the Tg(1016tuba1a:GFP) line. (A-B) Fluorescence images of the Tg(1016tuba1a:GFP) embryos at 2 days post fertilization (2 dpf) and 3 dpf. The transgene was mainly expressed in the nervous system including the brain, eye, spinal cord and lateral line neuromasts. (C) A needlepoke injury induced the transgene expression at the injury site (asterisks) in the retina of adult Tg(1016tuba1a:GFP) zebrafish at 4 dpi. The left part of the retina was intact and thus served as an uninjured control. (D) GFP+ cells also expressed Müller glia marker Glutamine synthetase (GS) at the injury site at 4 dpi. Scale bars in (A-C), 300 µm. Scale bar in (D), 100 µm. |


