
- Title
-
Competition between Jagged-Notch and Endothelin1 Signaling Selectively Restricts Cartilage Formation in the Zebrafish Upper Face
- Authors
- Barske, L., Askary, A., Zuniga, E., Balczerski, B., Bump, P., Nichols, J.T., Crump, J.G.
- Source
- Full text @ PLoS Genet.
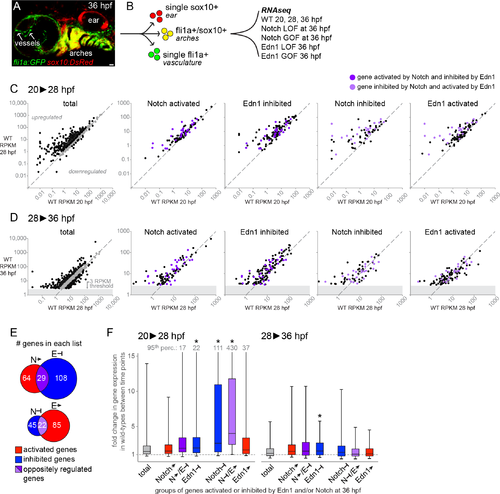
Jagged-Notch signaling represses genes strongly induced during pharyngeal arch differentiation. (A) 36 hpf fli1a:EGFP; sox10:DsRed embryo showing colocalization of GFP and DsRed in the arches (yellow), with DsRed-only cells (red) in the ear and GFP-only cells (green) in the vasculature (and macrophages). Scale bar = 20 μm. (B) Double-positive embryos were dissociated and subjected to FACS to isolate GFP/DsRed+ arch cells (yellow) for RNA sequencing. Wild-type embryos were profiled at three stages, and Notch and Edn1 loss- and gain-of-function (LOF, GOF) models at 36 hpf only. (C-D) Scatterplots depicting changes in expression (RPKM) among the genes on each list from 20 to 28 hpf (C) and 28 to 36 hpf (D). Genes to the left of the diagonal were upregulated, while genes to the right were downregulated. For the ‘total’ arch NCC-enriched gene charts, black points indicate genes with fold-changes ≥ 1.5, and grey points indicate genes with fold changes ≤ 1.5. In the other charts, black points correspond to genes uniquely present on a given list, whereas purple points indicate genes oppositely regulated by Notch and Edn1 (dark purple: Notch-activated/Edn1-inhibited; light purple: Notch-inhibited/Edn1-activated). The grey blocks in D reflect the filtering threshold (RPKM ≥ 3 at 36 hpf in wild types) used to generate the total list of arch NCC-enriched genes. (E) Venn diagrams display the numbers of genes on each list, with genes shared between the Notch-activated/Edn1-inhibited or Notch-inhibited/Edn1-activated lists indicated in dark and light purple, respectively. (F) Summary of gene expression changes (RPKM) in wild types between 20 and 28 hpf (left chart) and 28 and 36 hpf (right chart), for genes classified as activated (red) or inhibited (blue) by Notch or Edn1 signaling. The data are shown as the median fold-change value for all genes on a given list (black central line), with flanking second and third quartiles as the lower and upper boxes, respectively, and the 5th and 95th percentiles indicated by the whiskers. For the lists in which the 95th percentile value exceeded the upper boundary of the chart, the value is indicated at the top of the upper whisker. Compared with the total list of arch NCC-enriched genes, genes inhibited by Notch signaling and those that were both inhibited by Notch and activated by Edn1 (light purple) showed a significantly larger increase in expression from 20 to 28 hpf (p < 0.001). Genes inhibited by Edn1 also increased slightly but significantly from 20–28 and 28–36 hpf relative to the total list. The gray dashed line indicates a fold-change value of 1 (no change in expression) between the two time points. EXPRESSION / LABELING:
|
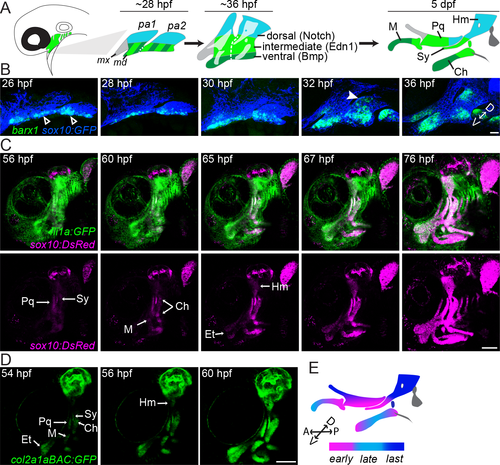
Accelerated cartilage differentiation in ventral-intermediate arch NCCs. (A) Schematic of pharyngeal arch patterning in zebrafish. At early patterning stages (~28 hpf), the first two pharyngeal arches (pa1, pa2) are divided into distinct dorsal (blue) and ventral/intermediate (green stripe) domains, with the latter resolving into intermediate (light green) and ventral (dark green) domains by 36 hpf. Notch activity governs the dorsal domain, Edn1 the intermediate domain, and Bmp signaling the ventral domain. The anterior maxillary domain (grey) is not significantly influenced by any of these pathways. The facial cartilages of the larval skeleton (5 dpf) are color-coded based on their arch origins. Hm, hyomandibula; Pq, palatoquadrate; M, Meckel’s; Sy, symplectic; Ch, ceratohyal. (B) barx1 (green) is upregulated ventrally (≤ 26 hpf, white open arrowhead) well before dorsal second arch expression can be detected (~32 hpf, white arrowhead). NCCs express the sox10:GFP transgene (blue). Shown are maximum intensity projections of confocal z-stacks of single-color in situs co-stained with a GFP antibody. The orientation of the dorsal (D)-ventral (V) axis is indicated. (C) Stills from a time-lapse movie (see S1 Movie) show the emergence of facial cartilages (sox10:DsRed+, magenta) from fli1a:EGFP+ ectomesenchyme (green). sox10:DsRed+ chondrocytes appear in a stereotyped sequence within the facial cartilages, with cells of the intermediate Sy and Pq cartilages detectable first at 56 hpf, followed by the ventral M and Ch cartilages at 60 hpf and the dorsal Hm at 65 hpf. (D) The same sequence of cartilage differentiation is seen slightly earlier in stills from a time-lapse movie of col2a1aBAC:GFP fish (see S2 Movie). The time-lapses in B and C were performed with a 20x objective using 0.5x digital magnification. Et, ethmoid cartilage. (E) Color-coded schematic of the sequence of chondrocyte differentiation in the facial skeleton. The orientations of the D-V and anterior (A)-posterior (P) axes are indicated. Scale bar in B = 20 μm; scale bars in C, D = 100 μm. EXPRESSION / LABELING:
|

Regulation of barx1+ condensations by Edn1 and Notch. (A) At 36 hpf, the intermediate sox9a domain (green) only partially overlaps with zones of barx1 expression (magenta) at the ventral and dorsal poles of each arch. The oral ectoderm (oe) and first pharyngeal pouch (p1) are shown for reference. (B, C) jag1b (green) and barx1 (magenta) are anti-correlated in dorsal NCCs at 36 and 48 hpf. (D-J) barx1 expression at 36 hpf in the first and second arches of wild-type controls, mutants, and overexpression embryos. Open arrowheads show the loss of ventral barx1 in edn1 mutants (E) and its restoration in 5/6 jag1b; edn1 mutants (J). The blue arrow in E indicates weak upregulation of barx1 in the intermediate domain of edn1 mutants. Upregulation of barx1 in the dorsal first arch (white arrowhead) and dorsal second arch (white arrow) is seen in Edn1-overexpressing embryos (F), jag1b mutants (G), notch2; notch3 mutants (H), and jag1b; edn1 mutants (J). Dotted lines in (I) show the arches of NICD-overexpression embryos in which barx1 is nearly absent. (K, L) Ectopic barx1 persists in jag1b mutants at least until 48 hpf, but no ectopic expression of sox9a is observed. (M, N) Representative barx1 expression patterns and skeletal preparations in embryos treated with the Notch inhibitor DBZ (10 μM) starting at the indicated time points. Earlier exposure to the DBZ inhibitor correlated with stronger ectopic barx1 expression (M) and more severe and penetrant Notch-type skeletal phenotypes (N). Fractions indicate the number of embryos in each treatment that exhibited unambiguous ectopic barx1 expression in the dorsal first arch (arrowheads in M) or showed posterior Pq malformations (arrowheads in N. DBZ treatment also caused systemic effects, including spinal curvature and cardiac edema, which reduced bone mineralization and led to a general reduction in the size of the craniofacial skeleton. Scale bars in B, C, J, L, M = 20 μm; scale bar in N = 100 μm. |
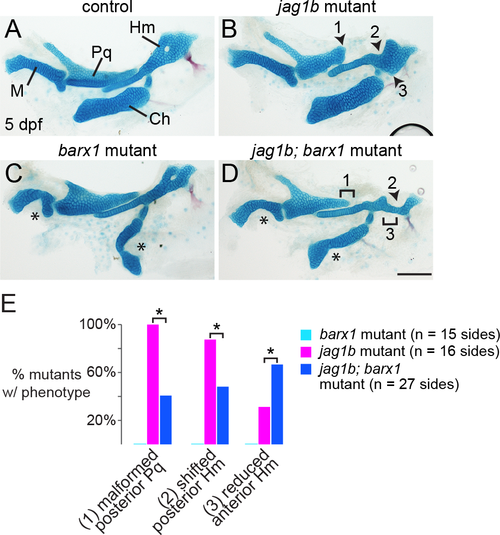
Loss of barx1 rescues some features of the jag1b skeletal phenotype. (A, B) Alcian staining of dissected jag1b mutant larval facial cartilages derived from the first and second arches show malformation of the posterior Pq (1), reduction of the anterior Hm (2), and a shift of the posterior Hm (3) such that it abuts the ventral Ch cartilage. (C) In barx1 mutants, the ventral M and Ch cartilages are reduced (asterisks). (D) In jag1b; barx1 mutants, the Pq truncation (1) and posterior Hm shift (3) are variably rescued, yet loss of the anterior Hm (2) becomes more penetrant. Scale bar = 100 μm. (E) Proportions of mutant larvae exhibiting the indicated phenotypes. None of these skeletal defects were observed in controls or barx1 mutants. For each phenotype, differences between the genotype groups were significant by Chi-Square test at p < 0.0001 (asterisks). PHENOTYPE:
|

Reduced growth of Hm cartilage in jag1b mutants. (A-F) kikGR RNA was injected into control fli1a:EGFP or jag1b; fli1a:EGFP embryos, and kikGR protein was photoconverted in small groups of GFP+ arch NCCs using a UV laser at 36 hpf. The same larvae were then reimaged at 6 dpf to assess contributions of kikGR-converted cells (magenta) to cartilage. In both controls (A-C) and jag1b mutants (D-F), photoconverted cells from the anterior, center, and posterior regions of the dorsal second arch contributed to the anterior Hm (A,D), posterior Hm (B,E) and posterior edge of the Hm and opercle bone (C,F). Relative to controls, labeled NCCs from jag1b mutants contributed to qualitatively smaller domains of cartilage by 6 dpf. Reproducible differences were seen in each mutant or control examined, with n numbers listed in each panel. (G) Summary of these fate maps showing contribution to anterior Hm (red), posterior Hm (dark blue), and opercle bone (light blue). Scale bars = 20 μm. |
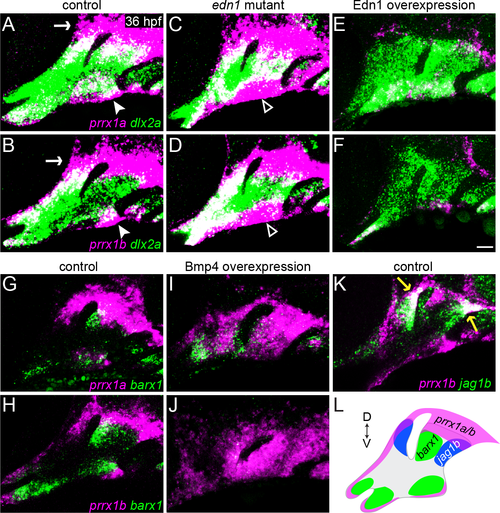
prrx1a and prrx1b are repressed by Edn1 and activated by Bmp4 signaling. (A-F) Two-color fluorescent in situs of 36 hpf wild-type embryos show that, relative to all arch NCCs (dlx2a, green), prrx1a and prrx1b (magenta) are expressed in dorsal arch NCCs and mesenchyme surrounding the ear (white arrow), as well as in a more limited ventral arch domain (white arrowhead). prrx1a and prrx1b are upregulated in ventral arch NCCs (white open arrowhead) of edn1 mutants and nearly lost upon overexpression of Edn1 in hsp70I:Gal4; UAS:Edn1 embryos subjected to a 20–24 hpf heat-shock treatment. (G, H) prrx1a/b and barx1 are expressed complementarily in the arches of wild types. (I, J) Overexpression of Bmp4 in hsp70I:Gal4; UAS:Bmp4 embryos heat-shocked from 20–24 hpf resulted in broad upregulation of prrx1a/b throughout the arches, with barx1 restricted to domains showing lower prrx1a/b expression. (K) prrx1b overlaps only slightly with jag1b expression at the dorsal-posterior tips of the first and second arches (yellow arrows). (L) Schematic depicting the expression patterns of prrx1a/b (magenta), barx1 (green), and jag1b (blue). Scale bar = 20 μm. |
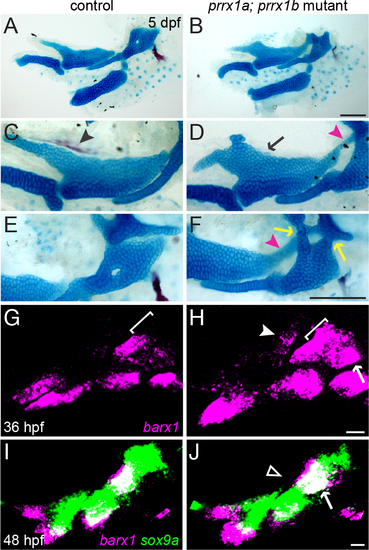
Combined loss of prrx1a and prrx1b results in ectopic dorsal cartilage. (A-F) prrx1a; prrx1b mutants develop ectopic cartilage, both from the dorsal-medial surface of Pq (black arrow) and connecting Pq to the otic cartilage (magenta arrowheads), as well as fusions of Hm to the otic cartilage (yellow arrows). The entopterygoid dermal bone (black arrowhead) that normally forms along the dorsal-medial surface of the Pq is also lost. (G, H) In prrx1a; prrx1b mutants at 36 hpf, barx1 (magenta) is ectopically upregulated in the dorsal first arch (white arrowhead), along the dorsal border of the second arch (white bracket, compare with G), and in the posterior dorsal second arch (white arrow). (I, J) By 48 hpf in prrx1a; prrx1b mutants, ectopic barx1 expression is no longer evident in the posterior first arch (open white arrowhead), and the second arch barx1+ domain is slightly larger than the sibling control (white arrow). sox9a expression (green) is largely normal at this stage in prrx1a; prrx1b mutants. Scale bars in B and F = 100 μm; scale bars in H and J = 20 μm. |

Partially overlapping functions of Prrx1a/b and Jagged-Notch signaling in dorsal cartilage development. (A-F) The expression of prrx1a and prrx1b (magenta) is largely normal in jag1b mutants (B, D) but is upregulated in ventral arch NCCs (white arrows) and reduced in dorsal NCCs upon forced Notch activation in hsp70I:Gal4; UAS:NICD embryos subjected to a 20–24 hpf heat-shock treatment. dlx2a expression (green) marks all arch NCCs. (G-I) edn1 mutants display a loss of ventral barx1 expression (green) and gain of prrx1b (magenta) (white arrowhead) (H). In jag1b; edn1 mutants, there is partial recovery of ventral barx1 expression in the second arch (white open arrowhead), which corresponds to regions where the ectopic expression of prrx1b is restored to control levels. (J, K) In 7/10 prrx1a; prrx1b mutants, jag1b expression is partially reduced in the dorsal second arch (yellow arrow). (L-O) Dissections of facial cartilage and bone derived from the first two arches show additive phenotypes in jag1b; prrx1a; prrx1b triple mutants. Similar to prrx1a; prrx1b double mutants, triple mutants display ectopic cartilage connecting Pq to the otic cartilage (black arrows). However, similar to jag1b single mutants, jag1b; prrx1a; prrx1b triple mutants also display irregularities in the main body of Pq (black arrowheads). Scale bar in K = 20 μm; scale bar in O = 100 μm. |
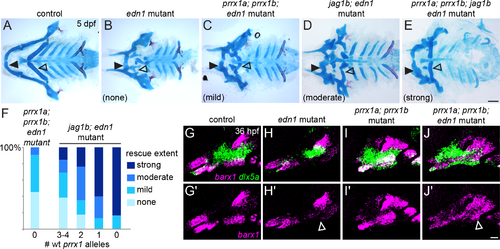
Simultaneous loss of prrx1a/b and jag1b further improves ventral cartilages in edn1 mutants. (A-E) Ventral views of dissected facial skeletons. edn1 mutants have much reduced ventral cartilage in the first (black closed arrowhead) and second (black open arrowhead) arches. Whereas jag1b; edn1 and prrx1a; prrx1b; edn1 mutants show some restoration of ventral cartilage, primarily in the second arch, quadruple prrx1a; prrx1b; jag1b; edn1 mutants show a prominent rescue of second arch Ch cartilage (black open arrowhead) and increased length of first arch M cartilage (black closed arrowhead). (F) Quantification of skeletal rescue in prrx1a; prrx1b; edn1 mutants (left column) and jag1b; edn1 mutants with decreasing numbers of wild-type prrx1a/b alleles (e.g. 4 wild-type alleles = pure jag1b; edn1 mutants; 0 wild-type alleles = quadruple mutant). Examples of no, mild, moderate, or strong rescue of the ceratohyal cartilage are shown in (B-E). Numbers in each genotype, from left to right: 11, 13, 17, 15, 6. (G-J) edn1 mutants show a loss of ventral barx1 expression (magenta, white open arrowhead) and a partial reduction of dlx5a (green), which are partially restored in prrx1a; prrx1b; edn1 triple mutants. The magenta channel is shown by itself in (G'-J'). Scale bar in E = 100 μm; scale bar in J' = 20 μm. |
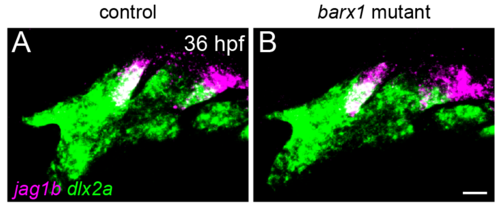
jag1b expression in barx1 mutants. jag1b expression (magenta) in posterior-dorsal cells of the first and second arches is indistinguishable between controls (A) and barx1 mutants (B) at 36 hpf. dlx2a (green) marks all arch NCCs. Maximum intensity projections of confocal z-stacks. Scale bar = 20 μm. |

Combined mutation of notch2 and notch3 causes dorsal skeletal defects. (A-D) Expression of Notch receptors in the pharyngeal arches. At 36 hpf, notch1a (A, magenta) and notch1b (B, magenta) are expressed in the ectodermal cleft adjacent to the first pharyngeal pouch but are undetectable in dlx2a+ NCCs (green). By contrast, notch2 (C) is strongly expressed in intermediate/dorsal NCCs (white arrow), and notch3 is expressed in dorsal second arch NCCs (white arrow), arch core mesoderm (dlx2a-negative, orange arrow), and the first ectodermal cleft (white arrowhead). (E-I) Mutation of notch2 (F) or notch3 (G) alone does not affect skeletal patterning, though a subset of notch2-/-; notch3+/- mutants (H) show some jag1b-like dorsal skeletal defects. Combined loss of both genes (I) results in a severe phenotype (two examples shown in I, I') consisting of a significant reduction in the size of the Hm and a shift towards a more posterior position (black open arrowhead), variable fusions of the second arch joint (black arrow), and abnormalities in the posterior Pq (black arrowhead). The overall size reduction and failure of bone mineralization are likely non-specific consequences of cardiac edema. Scale bar in D = 20 μm; scale bar in I = 100 μm. |

barx1 and sox9a mark different states of skeletal differentiation. Individual confocal sections of a barx1 (magenta) and sox9a (green) in situ hybridization in a wild-type embryo at 48 hpf, showing that the two markers are largely mutually exclusive, with the exception of the ventral tip of the forming Meckel’s and ceratohyal cartilages (white arrowheads in z12). Scale bars in all panels = 20 μm. |

Cross-regulation of prrx1a/b and hand2 expression. In hand2 mutants, expression of prrx1a (A, B; magenta) is slightly upregulated (arrowhead) in ventral cells, and prrx1b (C, D; magenta) is unaltered. (E, F) hand2 expression (magenta) is unaffected in prrx1a; prrx1b mutants. dlx2a (green) marks all arch NCCs. (G-J) hand2 expression (magenta) is not rescued in prrx1a; prrx1b; edn1 triple mutants (J) compared with edn1 single mutants (I). Dashed lines indicate approximate arch boundaries. Scale bar = 20 μm. |

Independently derived prrx1a; prrx1b mutants confirm specificity of skeletal phenotype. (A, B) Independently derived prrx1ab1246; prrx1bb1247 double mutants (B, B') phenocopy prrx1ael558; prrx1bel491 mutants (Fig 7B). Note the expanded cartilage in the palatoquadrate (black arrowhead) and the fusions between the hyomandibula and otic cartilage (black arrow). Scale bar = 100 μm. (C) Schematic of prrx1a/b TALEN (el558, el491) and CRISPR (b1246, b1247) alleles. In all cases, the mutant allele produces a frameshift (black) and premature stop codon upstream of the homeobox (Hx) and OAR domains (O). |

Unillustrated author statements PHENOTYPE:
|