
- Title
-
Lysosomal Disorders Drive Susceptibility to Tuberculosis by Compromising Macrophage Migration
- Authors
- Berg, R.D., Levitte, S., O'Sullivan, M.P., O'Leary, S.M., Cambier, C.J., Cameron, J., Takaki, K.K., Moens, C.B., Tobin, D.M., Keane, J., Ramakrishnan, L.
- Source
- Full text @ Cell

snapc1b Mutants Are Hypersusceptible to M. marinum and Have Increased Numbers of Macrophages that Display Vacuolated Morphology (A) Representative images of wild-type (WT) and snapc1bfh111/fh111 mutant larvae 4 days post-infection (dpi) with 150 M. marinum (Mm). Scale bar, 300 µm. (B) Quantification of Mm burden measured by fluorescence in snapc1bfh111/+ incross larvae at 5 dpi with 240 Mm. (C) Confocal images of green fluorescent macrophages (MΦ) and red fluorescent bacteria in intact granulomas of WT larvae and extracellular corded bacteria following complete granuloma breakdown in snapc1b mutant larva at 2 dpi with 200 Mm. Scale bar, 15 µm. (D) Quantification of bacterial cording in larvae from an incross of snapc1bfh111/+ parents at 5 dpi with 200 Mm. (E) Confocal images of the caudal hematopoietic tissue (CHT) of representative WT and snapc1b mutant larvae with red fluorescent macrophages at 6 days post-fertilization (dpf). Scale bar, 20 µm. (F and G) Quantification of fluorescent macrophages (F) and neutral red-stained cells (G) in the CHT of snapc1bfh111/+ incross larvae at 6 dpf. (H) Confocal images of fluorescent macrophages in the head of representative WT and snapc1b mutant larvae at 3 dpf. Dotted lines indicate the outline of larvae. Scale bar, 100 µm. (I) Total macrophage volume in the brains of WT and snapc1b mutant larvae at 5 dpf. Volumetric analysis performed from 3D confocal images on red fluorescence signal. (J) Confocal images of fluorescent macrophages in the brain of WT and snapc1b mutant larvae at 3 dpf. Scale bar, 60 µm. (K) Measurement of oblate ellipticity of macrophages in the brains of WT and snapc1b mutant larvae at 3 dpf. (L) Confocal images red fluorescent macrophages stained with LysoTracker green in the brains of 3 dpf WT and snapc1b mutant larvae. Scale bar, 30 µm. (M) Average lysosomal volume per animal normalized to total macrophage volume. Macrophage and lysosomal volumes were determined by volumetric analysis of red fluorescence (macrophages) and green fluorescence (lysosomes) in 3D confocal images. Statistical significance was assessed by one-way ANOVA with Sidak’s post-test (B, F, and G) or Student’s t test (I, K, and M). See also Figures S1 and S2, and Tables S2 and S3. PHENOTYPE:
|

Lysosomal Storage in snapc1b Mutants Compromises Physiological Efferocytosis (A) Still images from confocal video of green fluorescent macrophages in snapc1b mutant larval and WT sibling brains. Time of image is indicated in minutes. Arrows mark pseudopodia; arrowheads mark vacuoles. Vertical dotted red line indicates the time point immediately following phagocytic event. Scale bar, 15 µm. (B) Speed of WT and snapc1b mutant macrophages from the confocal video in (A). Average speed before and after the phagocytic events are indicated by a horizontal blue line. Green dots correspond to time points in the images shown in (A). (C) Migration of normal and vacuolated macrophages from the same animal to CCL2 injected into the HBV. (D) Representative confocal image of red fluorescent macrophages stained with acridine orange (AO) in brains of snapc1b mutant larvae and WT siblings at 3 dpf. Arrow marks a wild-type macrophage with very little AO staining. Arrowhead marks a rare AO positive macrophages seen in WT brains. Scale bar, 30 µm. (E and F) Confocal images (E) and quantification (F) of green fluorescent acridine-orange-stained unengulfed cell debris in the brains of snapc1b mutant larvae and WT siblings at 5 dpf. Scale bar, 150 µm. Images in (E) denoted as red data points in (F). Statistical significance was assessed by Student’s t test (B and F) and paired t test (C). See also Figure S3. EXPRESSION / LABELING:
PHENOTYPE:
|
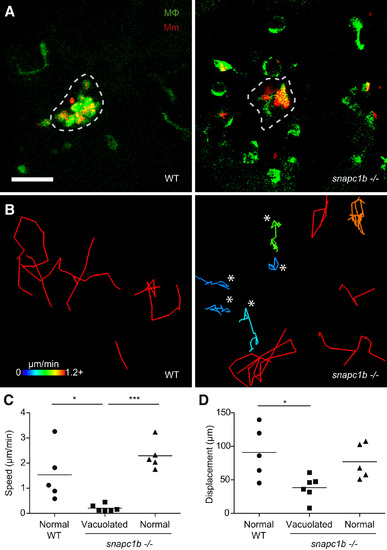
snapc1b Mutant Macrophages Fail to Participate in Granuloma Formation (A) Confocal images of granulomas in the hindbrain ventricle of snapc1b mutant larvae and WT siblings with green fluorescent macrophages at 2 dpi with 100 red fluorescent Mm. Scale bar, 60 µm. (B) Tracks of macrophage movement following granuloma formation in snapc1b mutant larvae and WT siblings shown in (A). Tracks are coded for speed. Tracks created by vacuolated macrophages are indicated with an asterisk. (C and D) Speed (C) and displacement (D) of snapc1b mutant and WT sibling macrophages in (A and B). Statistical significance was assessed using one-way ANOVA with Sidak’s post-test. |

Cathepsin L Deficiency Causes snapc1b Mutant Vacuolated Macrophage Morphology and Susceptibility to M. marinum (A) Quantitative real-time PCR of relative ctsl1 transcript in snapc1b+/- incross larvae at 6 dpf. Values normalized to transcript level of the heterozygous larvae, representative of two experiments. (B and C) Confocal images of green fluorescent macrophages in larvae injected with red fluorescent MR-Cathepsin L at 3 dpf, either following treatment with E64d or DMSO control at 2dpf (B) or in snapc1b mutants and WT siblings (C). Yellow or white arrowheads denote macrophages that are positive or negative for MR-Cathepsin, respectively. Scale bar, 50 µm. (D) Confocal images of green fluorescent macrophages stained with LysoTracker red in the brains of 3-dpf E64d-treated and DMSO control larvae. Scale bar, 50 µm. (E) Average macrophage speeds during a 5-hr movie in the brains of 3-dpf E64d-treated and DMSO control larvae. (F) Quantification of bacterial cording in DMSO control and E64d-treated larvae at 5 dpi with 150 Mm. (G) Confocal images of green fluorescent macrophages stained with LysoTracker red in the brains of 3-dpf ctsl1 morphants and control larvae. Scale bar, 50 µm. (H) Average macrophage speeds during a 5-hr movie in the brains of 3-dpf ctsl1 morphants and control larvae. (I) Quantification of bacterial cording in control, snapc1b, and ctsl1 morphants at 5 dpi with 200 Mm. (J) Quantification of vacuolated macrophages in the brains of 3-dpf WT or snapc1b mutant larvae following injection of ctsl1 RNA or control at 0 dpf. (K) Quantification of bacterial cording at 2 dpi with 215 Mm in the HBV of snapc1b mutants and WT siblings following injection of ctsl1 RNA or control. Statistical significance was assessed by ANOVA with Sidak’s post test (E, H, and J) or Fisher’s exact test (F, I, and K). See also Figure S4. EXPRESSION / LABELING:
PHENOTYPE:
|

Lysosomal Storage Disorders Disrupt Macrophage Migration and Cause Granuloma Breakdown (A and B) Confocal images of green fluorescent macrophages in the brain of 3-dpf control and morphant larvae, unstained (A) or following staining with LysoTracker Red (B). Scale bars, 10 µm. (C) Quantification of average macrophage speed in control and morphant larvae by macrophage morphology (wt, wild-type; vac, vacuolated). (D-F) Quantification of bacterial cording in control and morphant larvae at 3 dpi with 200 Mm. Statistical significance was determined using paired t tests with Bonferroni correction (C) and Fisher’s exact test (D-F). EXPRESSION / LABELING:
PHENOTYPE:
|

Macrophage Lysosomal Storage Disrupts Endocytic Recycling (A) Confocal images of red fluorescent macrophages following injection of green fluorescent dextran in E64d-treated and DMSO control larvae (3 dpf) at 5 and 30 hr post-injection. Yellow and white arrowheads denote macrophages with and without dextran, respectively. Scale bar, 50 µm. (B) Quantification of the percentage of macrophages that are positive for dextran in E64d-treated and DMSO control larvae (3 dpf) at 5 and 30 hr post-injection. (C) Confocal images of red fluorescent macrophages following injection of green fluorescent dextran in gba morphants and control larvae (3 dpf) at 5 and 30 hr post-injection. Yellow and white arrowheads denote macrophages with and without dextran, respectively. Scale bar, 50 µm. (D) Quantification of the percentage of macrophages that are positive for dextran in gba morphants and control larvae (3 dpf) at 5 and 30 hr post-injection. See also Figure S5. PHENOTYPE:
|

snapc1b Mutants Have Numerous Vacuolated Macrophages and Normal Neutrophil Numbers in the Caudal Hematopoietic Tissue, Related to Figure 1 (A and B) (A) Brightfield and (B) confocal images of the CHT of representative WT and snapc1b-/- mutant larvae at 5 dpf. Scale bar 50µm. (C) 8X magnification of outlined regions in (B) showing normal (top) and vacuolated (bottom) morphology. (D) Quantification of Lyz:eGFP positive, green fluorescent neutrophils in snapc1b+/- incross larvae at 6 dpf. |

Lysosomal Accumulation of Inert Particles Compromises Endocytic Recycling and Migration to the Initial Site of Mycobacterial Infection, Related to Figure 6 (A) Confocal images of green fluorescent macrophages in larvae mock-injected or injected with 5x10⁵ blue fluorescent 1 µm polystyrene beads. Scale bar, 12 µm. (B and C) Speed (B) and displacement (C) of macrophages with and without beads. (D) Confocal images of red fluorescent macrophages in 3dpf larvae pre-loaded with blue fluorescent polystyrene beads as in (A), injected 12 hr later with green fluorescent dextran and imaged at 5 and 30 hr post-dextran injection. Blue and white arrowheads denote macrophages containing dextran, with and without blue beads, respectively. Scale bar, 50 µm. (E) Quantification of macrophages that retained dextran at 5 and 30 hr post injection. (F) Diagram showing the experimental outline in which 2 dpf larvae were injected with Hoechst dye or beads in the CV followed by infection in the HBV with 200 Mm. (G and H) Confocal images of larval HBV containing green-fluorescent macrophages following CV injections with Hoechst (G) or blue fluorescent beads (H). Arrow and arrowhead denote Hoechst-positive macrophages that have migrated from the CHT, with and without phagocytosed red fluorescent Mm, respectively. Scale bar, 10 µm. (I) Number of macrophages in the HBV after injection of dye or beads in the CV followed by Mm infection in the HBV. Statistical significance was assessed using Student’s t test (B, C, and I), and one-way ANOVA with Sidak’s post test (E). |
Reprinted from Cell, 165, Berg, R.D., Levitte, S., O'Sullivan, M.P., O'Leary, S.M., Cambier, C.J., Cameron, J., Takaki, K.K., Moens, C.B., Tobin, D.M., Keane, J., Ramakrishnan, L., Lysosomal Disorders Drive Susceptibility to Tuberculosis by Compromising Macrophage Migration, 139-152, Copyright (2016) with permission from Elsevier. Full text @ Cell