
- Title
-
Histone deacetylase 1 is required for the development of the zebrafish inner ear
- Authors
- He, Y., Tang, D., Li, W., Chai, R., Li, H.
- Source
- Full text @ Sci. Rep.
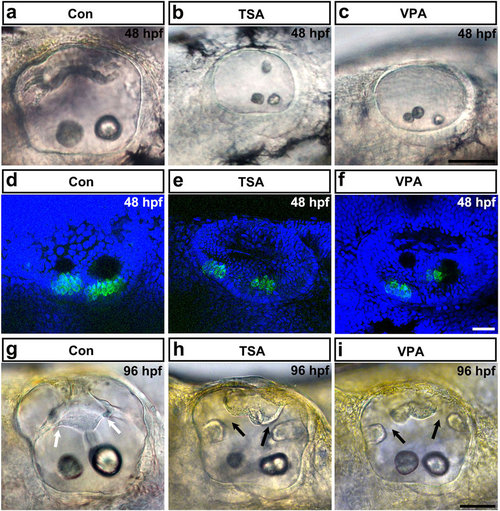
HDAC inhibitor treatment induces otic abnormalities and reduces the number of hair cells in the inner ear. (a-c) The morphology of the otoliths in control embryos and in embryos treated with TSA or VPA from 12 hpf onwards. HDAC inhibitor treatment caused morphant otolith defects at 48 hpf of development. (d-f) Images of hair cells expressing GFP in control, TSA-treated, and VPA-treated transgenic zebrafish at 48 hpf. Hair cells were detected by brn3c:gfp expression. HDAC inhibitor treatment reduced hair cell numbers in the inner ear. (g-i) The morphology of the semicircular canals in control (g), TSA-treated (h), and VPA-treated (i) zebrafish. HDAC inhibitor treatment induced aberrant semicircular canal formation. White arrows mark fused pillars, and black arrows mark unfused projections. All images are lateral views with the anterior to the left and the dorsal side up. Scale bars are 50 µm (a-c,g-i) and 20 µm (d-f). |
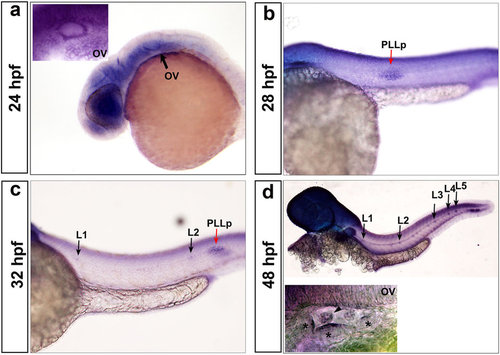
Zebrafish HDAC1 expression pattern revealed by in situ hybridization. (a-d) Zebrafish hdac1 is broadly expressed in the otic vesicle ((a,d) OV; indicated by black arrows at 24 hpf and 48 hpf), the posterior lateral line primordium (PLLp) ((b,c); indicated by red arrows at 28 hpf and 32 hpf), and the deposited neuromasts ((c,d) indicated by black arrows at 32 hpf and 48 hpf). The arrowhead shows protrusions of the semicircular canals, and the asterisks show the three cristae. |

Phenotypes of HDAC1 knockdown by antisense morpholino oligonucleotides. (a) The HDAC1 protein level in HDAC1-MO-injected embryos was significantly lower than control embryos at 24 hpf. (b) Gross phenotypic morphology of control and HDAC1 morphant embryos. The HDAC1 morphant at 48 hpf shows morphological abnormalities and abnormal otic vesicles. (c) Morphological development of the inner ear requires HDAC1. (c1) Control larvae (48 hpf) have two normal otoliths. The positions of the anterior otolith (ao) and posterior otolith (po) are indicated. Based on the otolith phenotypes, zebrafish HDAC1 morphants were classified into the following five categories: (c2) the one otolith group; (c3) the multiple otolith group; (c4) the absent otolith group; (c5) the two abnormal otolith group; and (c6) the two normal otolith group. (d) Percentages of embryos in each category (n = 321 for ConMO n = 157 for ConmisMO, and n = 211 for HDAC1 morphants). (e) The overall morphology of otic vesicles in control embryos (ConMO and ConmisMO) and HDAC1 morphants at 26 hpf (e1-e3) and 48 hpf (e4-e6). (f) Zebrafish semicircular canal phenotypes in controls (ConMO and ConmisMO), HDAC1 morphants, and HDAC1-MO + HDAC1mRNA co-injected embryos at 3 dpf, 4 dpf, and 5 dpf. Arrows show the junction of the anterior protrusion (ap) and the anterior bulge (ab). Arrowheads show the junction of the posterior bulge (pb) and posterior protrusion (pp). Asterisks show the junction between the ventral bulge (vb) and ventral protrusion (vp). Arrows in f8 and f9 mark ventral projections. The arrow, arrowhead, and asterisk in f14 mark unfused projections. All images are lateral views with the anterior to the left and the dorsal side up. Scale bars are 200 µm (b) and 50 µm (c,e,f). |
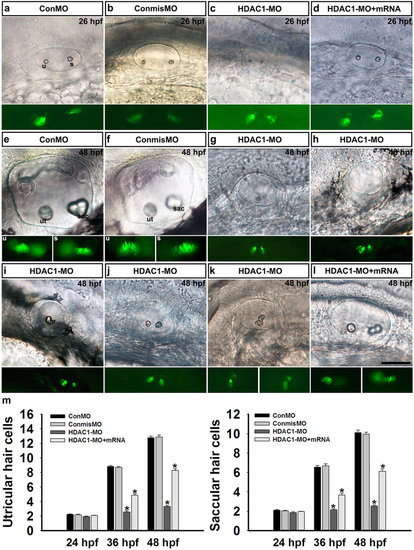
Hair cells in the inner ear. HDAC1 morphants exhibited a normal number of hair cells at 26 hpf but showed significantly fewer hair cells at later time points. (a-d) Brn3c:gfp expression in the inner ear of a control MO-injected embryo (ConMO) (a), a mismatch MO-injected control embryo (ConmisMO) (b), an HDAC1 morphant (c), and an HDAC1-MO + HDAC1mRNA co-injected embryo (d) at 26 hpf. (e-l) Brn3c:gfp expression in the utricle and saccule of a control MO-injected embryo (ConMO) (e), a mismatch MO-injected control embryo (ConmisMO) (f), HDAC1 morphants (g-k), and an HDAC1-MO + HDAC1mRNA co-injected embryo (l) at 48 hpf. All images show lateral views with the anterior to the left and the dorsal side to the top. Positions of the utricular (ut) and saccular (sac) maculae are indicated. (m) Quantification of the numbers of hair cells in the inner ear for each experimental condition at the indicated stages. Data are shown as mean ± SEM (n = 25-45). *p < 0.05. Scale bars, 50 µm. |
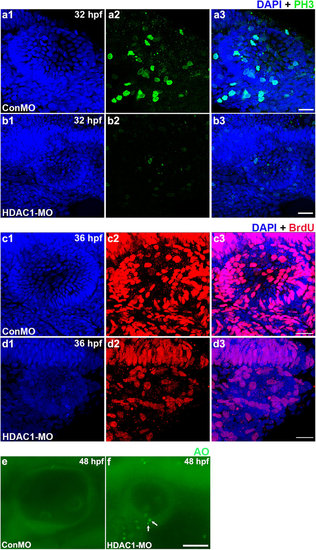
Analysis of cell proliferation and death in the otic vesicle of HDAC1 morphants. (a,b) Mitotic cells in the 32 hpf otic vesicle of a control embryo (a) and an HDAC1 morphant (b) were identified by phospho-histone H3 expression, a mitotic marker. (c,d) Dividing cells in the otic vesicle of a control embryo (c) and an HDAC1 morphant (d) at 36 hpf were identified by BrdU staining. HDAC1 morphants often contained decreased numbers of proliferating cells within the sensory epithelia. (e,f) AO labeling of dying cells in the otic vesicle of a control embryo (e) and an HDAC1 morphant (f) at 48 hpf. White arrows indicate AO-positive cells. HDAC1 morphants often contained multiple dying cells within the sensory epithelia. All images show lateral views with the anterior to the left and the dorsal side up. Scale bars, 20 µm (a-d), Scale bars, 50 µm (e,f). |
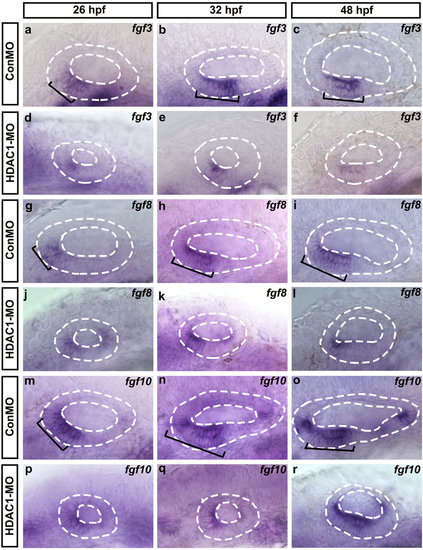
The effect of HDAC1 knockdown on the expression of fgf3/8/10 in the developing inner ear. Whole-mount in situ hybridizations with fgf3 (a-f), fgf8 (g-l), and fgf10 (m-r) probes in control embryos (a-c,g-i,m-o) and HDAC1 MO-injected embryos (d-f,j-l,p-r) at different developmental stages (as indicated). Black brackets indicate the localization of fgf3-expressing (a-c), fgf8-expressing (g-i), and fgf10-expressing (m-o) cells. Embryos injected with HDAC1 morpholino show reduction in levels of fgf3 (d-f), fgf8 (j-l), and fgf10 (p-r) expression. The otic vesicles are outlined by dashed lines. All images show lateral views with the anterior to the left and the dorsal side up. |
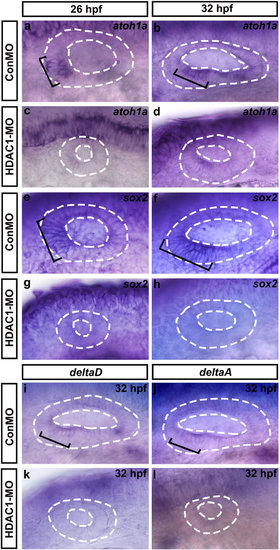
Whole-mount in situ hybridizations to atoh1a, sox2, deltaD, and deltaA. Lateral views of control (ConMO) and HDAC1 morphant otic vesicles at 26 hpf and 32 hpf. Black brackets indicate the regions of atoh1a-expressing (a,b) and sox2-expressing (e,f) cells as appropriate. Embryos injected with HDAC1 morpholino show a reduction in levels of atoh1a (c,d) and sox2 (g,h) expression. (i-l) Whole-mount in situ hybridizations to deltaD and deltaA. Lateral views of control (ConMO) and HDAC1 morphant otic vesicles at 32 hpf. Black brackets indicate the localization of deltaD-expressing (i) and deltaA-expressing (j) cells. Loss of function of HDAC1 reduced the expression of deltaD (k) and deltaA (l). Otic vesicles are outlined by dashed lines. All images show lateral views with the anterior to the left and the dorsal side up. |
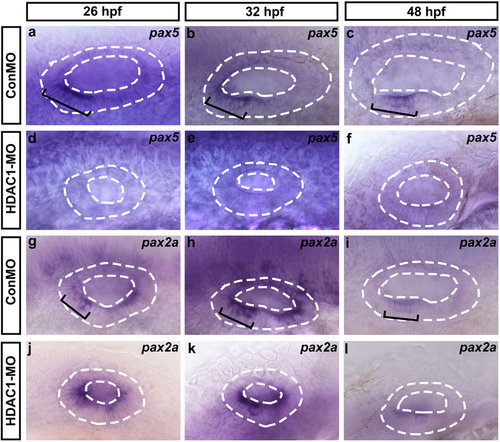
Whole-mount in situ hybridizations to pax5 and pax2a. (a-l) Lateral views of control (ConMO) and HDAC1 morphant otic vesicles at 26 hpf, 32 hpf, and 48 hpf. Black brackets indicate the localization of pax5-expressing (a-c) and pax2a-expressing (g-i) cells as appropriate. Embryos injected with HDAC1 morpholino show reductions in the levels of pax5 (d-f) and pax2a (j-l) expression. The otic vesicles are outlined by dashed lines. All images show lateral views with the anterior to the left and the dorsal side up. |
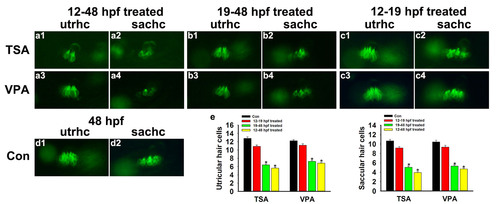
Effect of HDAC inhibitor on hair cell numbers at 48 hpf. (a-c) Brn3c:gfp transgenic zebrafish embryos treated with HDAC inhibitors (12-48 hpf, 19-48 hpf, and 12-19 hpf) and fixed at 48 hpf to examine the numbers of hair cells in the inner ear. (e) Quantification of the numbers of hair cells in the inner ear for each experimental condition. Data are shown as mean ± SEM (n = 14–19). * p < 0.05. utrhc: utricular hair cell; sachc: saccular hair cell. |

Whole-mount in situ hybridizations to atoh1a. (a-b) Lateral views of embryos injected with control morpholino and HDAC1 morpholino and fixed at 14 hpf to examine expression of atoh1a in the otic placode. (*) dorsal hindbrain progenitors. Arrows: otic placode (op). |
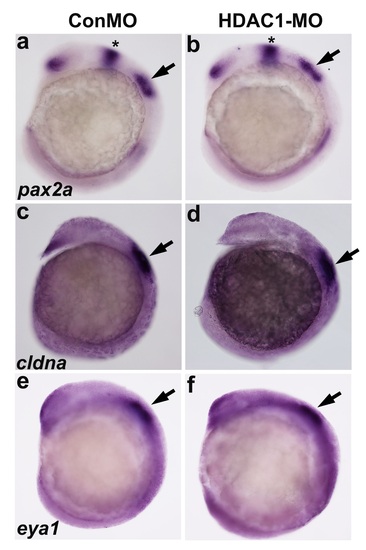
Expression of otic placode markers. (a-b) Lateral views of embryos injected with control morpholino and HDAC1 morpholino and fixed at 14 hpf to examine expression of pax2a (a-b), cldna (c-d) and eya1 (e-f) in the otic placode. The otic placodes are indicated by black arrows. (*) midbrain-hindbrain boundary. |