
- Title
-
Epithelial cell fate in the nephron tubule is mediated by the ETS transcription factors etv5a and etv4 during zebrafish kidney development
- Authors
- Marra, A.N., Wingert, R.A.
- Source
- Full text @ Dev. Biol.

etv5a transcripts show early expression in the renal progenitor field where the MCC domain later emerges. (A) Schematic of the fully segmented zebrafish pronephros at 24 hpf, shown in both a lateral and dorsal view. Enlargement depicts the somite map of transporter cell segments and the MCC domain. (B) WISH at the 15 ss reveals that the etv5a (purple) expression domain correlates to the rostral and central regions of the renal progenitor field, demarcated by the marker slc4a4a (purple). slc12a3 (purple) denotes the caudal region, and somites are stained by smyhc1 in red. Black brackets highlight etv5a, slc4a4a, and slc12a3 expression domains in the pronephros. (C) The expression domain of etv5a is restricted in the proximal tubule during nephrogenesis, where the MCC domain, marked by odf3b (purple), expands. Insets show magnified view of etv5a and odf3b domains in the pronephros, denoted by the black bars. At the 28 ss, the etv5a domain is largely restricted to the PST (black bar), with weak expression in neighboring pronephros segments (black dots). The expression domain of odf3b at the 28 ss stage spans a caudal portion of the PCT (black dots), the PST (black bar), and the DE segment (black dots). (D) Schematic of etv5a cDNA depicting the two functional domains, acidic (light green) and ETS (dark gray), of the Etv5a protein. Abbreviations: P (podocyte), N (neck), PCT (proximal convoluted tubule), PST (proximal straight tubule), DE (distal early), CS (corpuscle of Stannius), DL (distal late), PD (pronephric duct), C (cloaca), ss (somite stage), etv5a (ets variant 5a), slc4a4a (solute carrier family 4 (sodium bicarbonate cotransporter), member 4a), slc12a3 (solute carrier family 12 (sodium/chloride transporter), member 3), smyhc1 (slow myosin heavy chain 1), odf3b (outer dense fiber of sperm tails 3b), TAD (transactivation domain). EXPRESSION / LABELING:
|
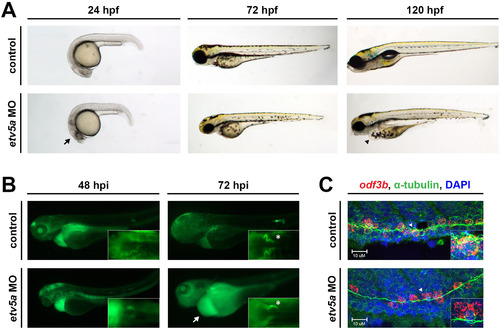
etv5a morphants have possible kidney dysfunction. (A) Live time course demonstrates the formation of an edema (black arrowhead), indicative of fluid imbalance and possible renal dysfunction, by 120 hpf in etv5a morphants (etv5a MO) compared to control siblings. etv5a morphants also have a smaller, darker head (black arrow) than the control embryos. (B) Control embryos demonstrate proper renal function by clearing FITC-dextran over time. etv5a morphants continue to accumulate fluorescence (white arrow), suggesting improper renal clearance. White asterisks denote uptake of dextran by the PCT of both the control and etv5a morphant. (C) Whole mount IF in combination with FISH demonstrates that etv5a morphants have fewer odf3b+ cells (red) than control siblings at 24 hpf. Insets show digital zoom of single odf3b+ cells (white arrowhead) associated with multiple cilia (green) marked by α-tubulin in both the control and etv5a morphants. Nuclei are stained by DAPI in blue. Abbreviations: MO (morpholino), hpf (hours post fertilization), hpi (hours post injection). |

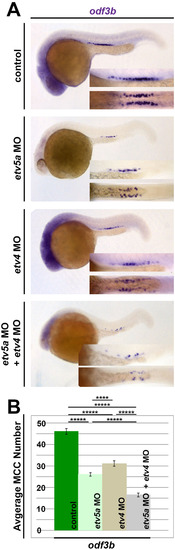
etv5a is required for MCC development. (A) At 24 hpf, WISH analysis demonstrates etv5a loss of function via morpholino (MO) knockdown (etv5a MO, etv5a MO2) and deletion of the acidic domain (etv5aΔacidic) resulted in reduced expression of the MCC markers odf3b and centrin 4 (cetn4) (purple) in the pronephros. Insets are a magnification of the MCC domain in both a lateral (top) and dorsal (bottom) view. (B) odf3b expression via WISH in 24 hpf embryos co-injected with etv5a capped RNA (cRNA) and each morpholino (MO) was not as reduced as MO injection alone. Injection of etv5a cRNA also did not produce a great change in odf3b expression in the pronephros. (C) Quantification demonstrates a significant decrease in average MCC number for cetn4 in all three etv5a knockdown versions. (D) etv5a loss of function (etv5a MO, etv5a MO2, and etv5aacidic) produced a significant reduction in the average MCC number compared to the control, as marked by odf3b. Co-injection of etv5a cRNA and MO partially rescued the MCC phenotype seen in embryos injected with MO only, where injection of etv5a cRNA alone did not produce a significant change in average MCC number compared to the control. Images and quantification are representative of at least 50 embryos, and error bars denote standard error. p-values: *****p<0.001, ****p<0.002, **p<0.02. |
Redundancy between etv5a and etv4 in MCC formation. (A) In embryos injected with either etv5a MO, etv4 MO, or a combination of etv5a MO and etv4 MO, there is reduced expression of odf3b (purple), where the greatest loss appears in the absence of both etv5a and etv4 transcripts. (B) A significant decrease in average MCC number results in the loss of etv5a, as well as the loss of etv4. Injection of etv5a and etv4 together caused a greater decrease in the average number of MCCs. Representative images are shown for the quantified groups (n>50 for each), and standard error is depicted by the error bars. p-values: *****p<0.001, ****p<0.002. |

RA signaling acts upstream of etv5a to promote MCC fate. (A) WISH analysis on 24 hpf embryos demonstrates an increased etv5a expression domain after treatment with exogenous retinoic acid (+RA). Conversely, treatment with the pan-RA inhibitor DEAB completely ablates etv5a expression in the pronephros. Insets show a magnified view of the pronephros, where black bars denote the etv5a domain. (B) Exogenous RA significantly increased average etv5a length (µm) in the pronephros, but etv5a expression is lost after DEAB treatment. (C) Exogenous RA increases odf3b expression in both control and etv5a morphant embryos (etv5a MO), however etv5a morphants still appear to have a reduction of odf3b transcripts when compared to control siblings analyzed by WISH. odf3b expression is greatly reduced in both control and etv5a morphant embryos treated with DEAB. A magnified lateral (top) and dorsal (bottom) view of the odf3b domain is presented in the insets. (D) Quantification shows a significant increase of average MCC density/somite in etv5a morphants+RA compared to etv5a morphants, and that treatment with RA rescues average MCC density in etv5a morphants to the control value. Morphants treated with DEAB have a significantly lower MCC density/nephron* than control embryos treated with DEAB. At least 50 embryos were analyzed for each treatment, and the error bars represent standard error. p-values: *****p<0.001. |

Notch signaling acts upstream to inhibit etv5a and restrict MCC fate. (A) WISH staining demonstrates expanded etv5a and odf3b domains after treatment with the Notch-inhibitor DAPT. A magnified lateral view of the etv5a domain with expression denoted by the black bars can be seen in the insets. odf3b domain is shown both laterally (top) and dorsally (bottom) in the insets. (B) Quantification of etv5a expression length (µm) in the pronephros shows a significant increase in DAPT-treated embryos. (C) MCC density is significantly increased in control and etv5a morphants (etv5a MO) both treated with DAPT, however there is still a significant difference in MCC density between DAPT and etv5a MO+DAPT embryos. Error bars represent standard error. p-values: *****p<0.001; **p<0.10. |

Comparison ofetv5aknockdown phenotypes and blood pooling inetv5amorphants. (A) WT embryos were injected with either etv5a MO2 or etv5aΔacidic at the one-cell stage, and then monitored over time for any physical changes. In this live time course, both etv5a MO2 and etv5aΔacidic morphants have some head darkening at the 24 hpf stage (black arrow), which is not seen in the uninjected siblings. (B)etv5a MO injected embryos stained with o-dianisidine show some blood pooling in the head region (black asterisk) when compared to uninjected siblings. (C) Quantification of o-dianisidine experiments demonstrate approximately 30% of etv5a morphants have abnormal blood pooling in the head, where the uninjected siblings do not display a circulation problem. |
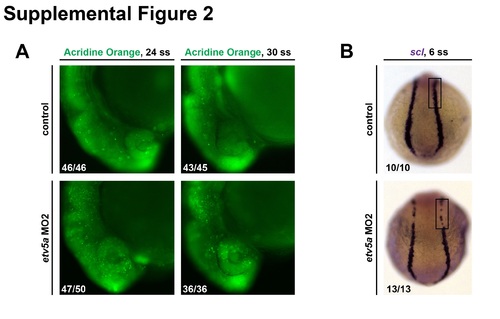
etv5aMO2 assays. (A) Embryos injected with etv5a MO2 have more cell death, as shown by AO staining, in the head region compared to control embryos at the same time points. However, the amount of cell death is reduced in etv5a MO2 injected embryos from the 24 ss to the 30 ss. (B) WISH analysis on 6 ss embryos shows reduced scl (purple) expression in embryos injected with etv5a MO2. Embryo counts for each observed phenotype are as indicated in the lower left corner of the corresponding panel. For control 30 ss, 2/45 embryos had elevated AO cell numbers compared to the majority phenotype that is shown, and for etv5a MO2 24 ss, 3/50 embryos had further elevated AO cell numbers compared to the majority phenotype that is shown. |
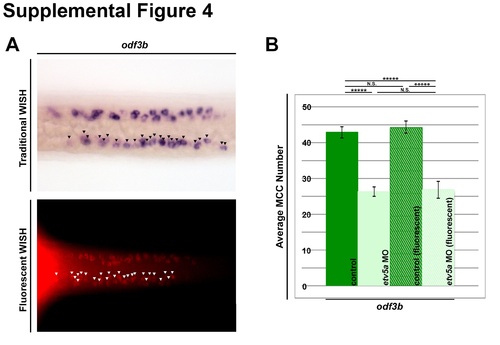
MCC counting method. (A) Representative images of odf3b expression in the zebrafish pronephros at 24 hpf of traditional WISH (purple) and fluorescent WISH (red). Black and white arrowheads denote individual odf3b+ cells. (B) Quantification of average MCC number as marked by odf3b comparing control and etv5a MO embryos analyzed by WISH (n=33 each) and fluorescent WISH (n=10 each). There is no significant difference between the two controls or the two groups of etv5a morphants determined by two-tailed student’s t-test. P-value *****p<0.001, N.S. (non-significant). |

etv4expression in renal progenitors is unaffected by alterations in RA or Notch expression levels. In WT embryos, etv4 transcript expression localizes to the central nervous system, as well as Rohon-Beard neurons and the tailbud, while showing low-level ubiquitous expression throughout the axial mesoderm at 24 hpf. Embryos treated with RA, DEAB or DAPT exhibited no change in etv4 expression in the pronephros. |
Reprinted from Developmental Biology, 411(2), Marra, A.N., Wingert, R.A., Epithelial cell fate in the nephron tubule is mediated by the ETS transcription factors etv5a and etv4 during zebrafish kidney development, 231-45, Copyright (2016) with permission from Elsevier. Full text @ Dev. Biol.