- Title
-
The Rag-Ragulator Complex Regulates Lysosome Function and Phagocytic Flux in Microglia
- Authors
- Shen, K., Sidik, H., Talbot, W.S.
- Source
- Full text @ Cell Rep.
|
Mutational Analysis Demonstrates that rraga and lamtor4 Are Essential for Microglia Development (A–F) Comparison of microglia numbers in rragast77/st77 mutants, lamtor4st99/st99 mutants, and WT siblings. (A, B, D, and E) Neutral red-stained larvae of the indicated genotypes at 5 dpf are shown. Dorsal views, scale bar, 50 µm. (C and F) Quantifications of neutral red-stained microglia in rraga (C) and lamtor4 (F) mutants at 3, 4, and 5 dpf are shown. (G–J) Molecular analysis of mutations in rraga. (G) Sequence chromatograms show point mutation in rragast77 mutation. (H) Sequence deleted in rragast110 mutation shows exon-intron boundary and deleted splice donor. (I) Immunoblot showing pronounced reduction of RagA protein in rragast77/st77 mutants at 5 dpf. Actin is shown as a loading control. (J) Schematic of RagA protein shows conserved domains and positions of the mutant lesions. (K–M) Molecular analysis of mutations in lamtor4. (K) Sequence chromatograms show point mutation in lamtor4st74 mutation, which changes the ATG initiation codon to ATA. (L) Sequence deleted in lamtor4st99 mutation shows the reading frame in WT and the alteration caused by the 11-bp deletion in the mutation. (M) Schematic of the Lamtor4 protein shows positions of the mutant lesions. Larvae shown in (A), (B), (D), and (E) were genotyped by PCR after photography. EXPRESSION / LABELING:
PHENOTYPE:
|
|
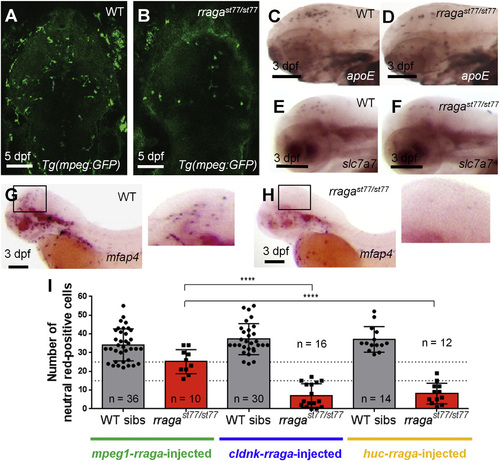
rraga Acts Autonomously at an Early Stage of Microglia Development (A and B) Reduction of microglia in rragast77/st77 mutants is detected by imaging the mpeg1:EGFP transgene in living WT (A) and mutant (B) larvae at 5 dpf. Dorsal views, anterior to the top. (C–H) Analysis of other microglia and macrophage markers reveals reduction of microglia at 3 dpf. Probes for apoe (C and D), slc7a7 (E and F), and mfap4 (G and H) were detected by whole-mount in situ hybridization. Boxes in (G) and (H) show region magnified in the corresponding insets. Lateral views, anterior to the left. (I) Quantification of neutral red-stained microglia in rragast77/st77 mutants after transient expression of the WT rraga coding sequence under control of regulatory sequences from mpeg1, cldnk, and huc. Only mpeg1-rraga, which drives expression in macrophages and microglia, significantly rescued microglia in the mutants. Dotted lines at 15 and 25 show weak and strong rescues, respectively (****p ≤ 0.0001). All scale bars, 50 µm. All larvae shown were genotyped by PCR after photography (A–H) or after visually scoring neutral red phenotypes (I). EXPRESSION / LABELING:
PHENOTYPE:
|
|
Dysregulated Lysosomal Activity in Microglia of rragast77/st77 Mutants (A and B) Analysis of RNA sequencing data revealed that genes associated with lysosomal activity are significantly upregulated in rragast77/st77 mutants at 5 dpf. Using the DAVID Bioinformatics Resources, genes showing at least a 1.5-fold upregulation were classified according to (A) Kegg Pathway terms and (B) molecular functions (GOTERM_MF_FAT). (C and D) Visualization of Lysotracker Red and Tg(mpeg1:EGFP) in WT (C, n = 4) and rragast77/st77 mutants (D, n = 4) reveals that lysosomes are increased in microglia in the mutants. Larvae shown in (C) and (D) were genotyped by PCR after photography. |
|
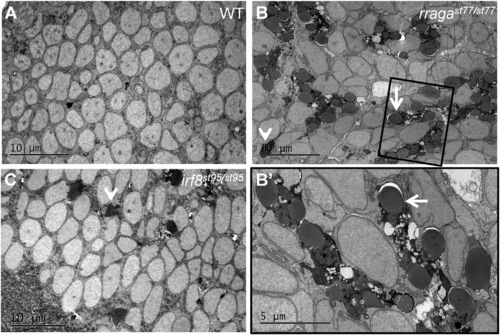
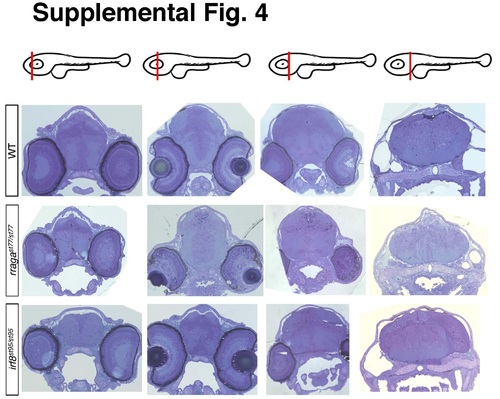
Abnormal Vacuolar Organelles in Microglia and Uncleared Apoptotic Neurons in rragast77/st77 Mutants (A–C) Transmission electron micrographs of the dorsal midbrain of (A) WT, (B and B′) rragast77/st77, and (C) irf8st95/st95 larvae at 4 dpf. Boxed region in (B) is shown at higher magnification in (B′). Microglia in the rragast77/st77 mutants have a striking accumulation of vacuolar organelles that appear to contain undigested material (white arrows). Microglia were absent in the irf8 mutant. In both mutants, uncleared corpses of apoptotic neurons are present (white arrowheads). These phenotypes also were evident in mutants stained with acridine orange ( Figure S3). Toluidene blue-stained sections of the same larvae are shown in Figure S4. Larvae were genotyped by PCR from tail biopsies collected immediately prior to fixation. |
|
Accumulation of Undigested Neuronal Material in Microglia of In rragast77/st77 Mutants (A–D, G, and H) Confocal images show living larvae bearing transgenes that label neurons Tg(nbt:DsRed) and microglia Tg(mpeg1:EGFP). (A–E) In WT (A and C) and rragast77/st77 mutant (B and D) larvae, arrows indicate microglia that contain neuronal material. In WT larvae, more microglia contain neuronal material at 4 dpf (A and E) than at 6 dpf (C, C′, and E), whereas most microglia in mutants contained neuronal material at both 4 and 6 dpf (B, D, D′, and E). Each point in (E) represents the data from one larva. (F and G) Frames from time-lapse movies of WT (F) and rragast77/st77 (G) mutant larvae starting at 4 dpf, with time points indicated in minutes. (H) Quantification of the number of neuronal puncta inside microglia in time-lapse movies of WT and rragast77/st77 mutant larvae. Each line represents a single microglia (WT, n = 4 cells from three larvae; mutant, n = 4 cells from three larvae). (I) Immunoblot of whole-animal protein lysates at 5 dpf shows normal LC3-I to LC3-II conversion, but an accumulation of p62 in rragast77/st77 mutants. Actin is shown as a loading control. All larvae shown in (A)–(H) were genotyped by PCR after photography. Larvae analyzed in the immunoblot (I) were genotyped as described in the Experimental Procedures. |
|
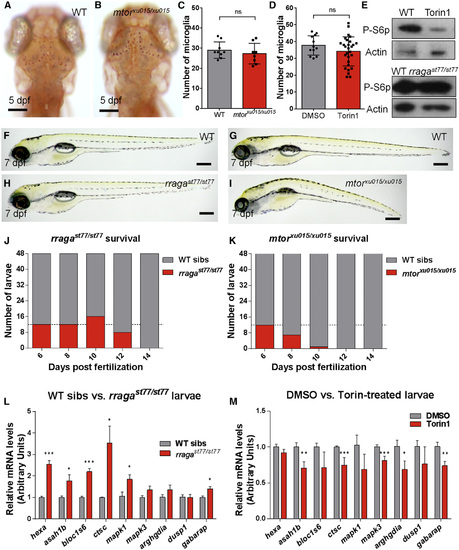
Distinct Phenotypes of mtorxu015/xu015 and rragast77/st77 Mutants (A and B) Images show living neutral red-stained WT (A) and mtor mutant (B) larvae at 5 dpf. Dorsal views, anterior to the top. (C and D) There was no significant reduction of the number of microglia at 5 dpf in mtor mutants or WT animals (C) treated with the mTOR inhibitor Torin1 (D). (E) Immunoblots of 5-dpf whole-animal protein lysates showing reduction of phospho-S6p levels after Torin1 treatment compared to control DMSO treatment. The level of phospho-S6p was similar in rragast77/st77 mutants and their WT siblings. Actin is shown as a loading control. (F–I) Lateral views of living larvae at 7 dpf show normal morphology of rragast77/st77 mutant (H) and abnormal morphology of mtorxu015/xu015 mutant (I), compared to their WT siblings (F and G, respectively). (J and K) Analysis of survival of rragast77/st77 (J) and mtorxu015/xu015 (K) mutants. Progeny of intercross of heterozygotes were raised, and 48 animals were genotyped by PCR for the mutant lesions at the indicated time points. Very few mtorxu015/xu015 mutants survived to 10 dpf, but most rragast77/st77 mutants survived to 12 dpf. For a homozygous viable mutation, 12 mutants would be expected at each time point on average (dotted lines). (L) qRT-PCR of whole-animal RNA samples at 5 dpf showed an increase in expression of some target genes of the lysosomal transcription factor TFEB in rragast77/st77 mutants relative to their WT siblings. (M) Similar qRT-PCR did not detect any increased expression of the genes analyzed in mtorxu015/xu015 mutants, and many were significantly reduced. Error bars show SEM of samples analyzed in triplicate. Statistical significance determined by a two-tailed t test (*p < 0.05, **p < 0.01, and ***p < 0.005). All scale bars, 50 µm. All larvae analyzed in (A)–(C) and (F)–(I) were genotyped by PCR. rragast77/st77 mutants analyzed in the immunoblot (E) were genotyped as described in the Experimental Procedures. rraga mutants analyzed by RT-PCR were identified by neutral red staining prior to RNA isolation. |
|
Related to Figure 1. Neutral red staining of rragast110/st110, rragast77/st110, lamtor4st74/st99, lamtor4st74/st99 mutants. (A-H) Images of living zebrafish larvae of the indicated genotypes at 5 dpf after neutral red staining. Microglia were reduced to a similar extent in all mutants. Dorsal views, anterior to the top. All scale bars are 50µm. All larvae shown were genotyped by PCR after photography. |
|
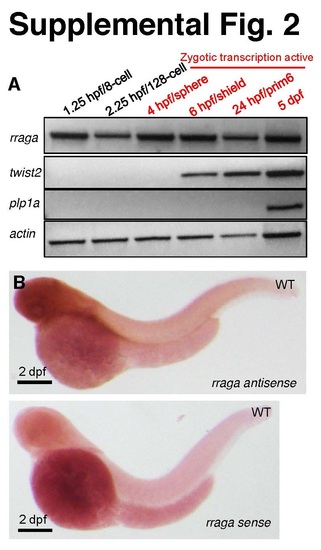
Related to Figure 2. rraga mRNA is maternally expressed and widely distributed in the embryo. (A) Time course of rraga mRNA expression analyzed by RTPCR of whole-animal lysates prepared at the indicated stages before (black) and after (red) the maternal-zygotic transition. RNA for rraga is detected before the zygotic transcription is active, in contrast to zygotically expressed control genes twist2 and plp1a. (B) Representative image of a 2 dpf embryo stained by in situ hybridization with antisense and sense probes for the rraga transcript. The antisense probe detected widespread expression, whereas the control sense probe showed background staining. |
|
Related to Figure 3. Acridine orange staining of rragast77/st77 and irf8st95/st95 mutants. (A-D) Live staining with Acridine Orange at 4 dpf showed increased numbers of apoptotic puncta in rragast77/st77 mutants, with some larger clusters (B, arrows), compared to wildtype siblings (A). irf8st95/st95 mutants also exhibit an increase in the number of acridine orange labeled puncta (D) compared to wildtype siblings (C), but the larger clusters of puncta were not evident. All scale bars are 50µm. All larvae shown were genotyped by PCR after photography. |
|
Related to Figure 4. Histological sections of rragast77/st77 and irf8st95/st95 mutants. Toluidine Blue-stained sections of brains from larvae of the indicated genotypes at 4 dpf. The approximate positions of the sections along the anterior-posterior axis are indicated by the red lines in the schematics at the top of each column. Ultrathin sections from these same samples were taken from approximately the second position shown and analyzed by TEM, as shown in Figure 4. Larvae were genotyped by PCR from tail biopsies collected immediately prior to fixation. |


