
- Title
-
Treponema pallidum (syphilis) antigen TpF1 induces angiogenesis through the activation of the IL-8 pathway
- Authors
- Pozzobon, T., Facchinello, N., Bossi, F., Capitani, N., Benagiano, M., Di Benedetto, G., Zennaro, C., West, N., Codolo, G., Bernardini, M., Baldari, C.T., D'Elios, M.M., Pellegrini, L., Argenton, F., de Bernard, M.
- Source
- Full text @ Sci. Rep.
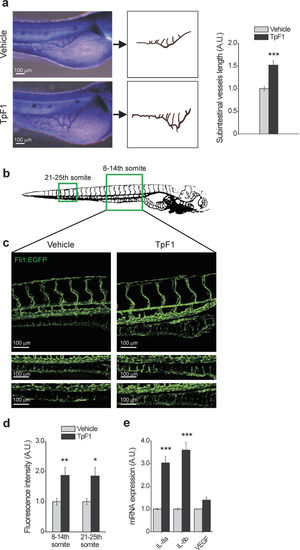
TpF1 has angiogenic activity in zebrafish. (a) Comparison of the blood vessel patterning, at the sub-intestinal area (SIVs), between vehicle- and TpF1-treated larvae. Animals were injected in the yolk 1 dpf and the alkaline phosphatase-based assay was performed at 3 dpf. Scale bar = 100 μm. Graph represents the fold increase in SIV length referring to the value of vehicle-treated animals, set as 1. Data are expressed as mean ± S.E.M. (n = 20 for each treatment). Significance was determined by Student’s t-test for data of TpF1-treated fish versus vehicle-exposed fish. ***p < 0.001. (b) Illustration of the vascular system of a 4 dpf larva. Regions for image acquisition are indicated by boxes. (c) Embryos at 2 dpf were injected in the yolk or in the caudal vein plexus with TpF1 or vehicle. Representative images were taken at 4 dpf by confocal microscopy at 20 × magnification. Scale bar = 100 μm. (d) Integrated density of fluorescence in the green channel was determined in the segment between 8 and 14th and between 21st and 25th somite. Values of vehicle-treated animals were set as 1 A.U. and used as reference for TpF1-treated animals (mean ± S.E.M., n = 6). Significance was determined by Student’s t-test for data of TpF1-treated fish versus vehicle-exposed fish. *p < 0.05; **p < 0.01. (e) Embryos were injected in the yolk with TpF1 or vehicle at 2 dpf. RNA was extracted at 4 dpf and the expression of VEGF, IL-8a and IL-8b was evaluated by RT-PCR. For each sample, data were normalized to the endogenous reference gene β-actin. Vehicle-treated fish were taken as reference and set as 1 A.U. Expression levels of TpF1-exposed fish were expressed as fold change relative to the expression level of vehicle-treated fish. Data represent mean ± S.E.M. (n = 30 larvae for each treatment). Significance was determined by Student’s t-test for data of TpF1-treated fish versus vehicle-exposed fish. ***p < 0.001. |