
- Title
-
Transcriptomes of post-mitotic neurons identify the usage of alternative pathways during adult and embryonic neuronal differentiation
- Authors
- Tallafuss, A., Kelly, M., Gay, L., Gibson, D., Batzel, P., Karfilis, K.V., Eisen, J., Stankunas, K., Postlethwait, J.H., Washbourne, P.
- Source
- Full text @ BMC Genomics

Distribution of HA-Uprt-mCherry transgene expression on cross sections of adult zebrafish brain. a Section showing HA labeling (cyan) in the dorsal telencephalon (dT) and the diencephalic ventricle (DiV). b High magnification of the dorsal habenula (Had) in the anterior diencephalon, with HA labeling in cells and projections (white arrowhead) from the Had to the interpeduncular nucleus (IPN) in the mesencephalon. c Section through the cerebellum showing HA-localization near the rhombencephalic ventricle (RV, Lobus caudalis cerebelli (LCa)). d HA-expression in the ventral half of the eminentia granularis (EG) and axon projections. Elavl3/4 labeling (white) marks most cells of the EG. e Co-labeling of HA and the proliferation marker PCNA (yellow) in a high magnification of the diencephalic ventricle (DiV) shows no overlap. f HA-labeling and the glial marker GFAP (red) are not co-expressed in the same cells. g HA-positive cells in the vicinity of the diencephalic ventricle. Elavl3/4 labeling (white) partially overlaps with HA labeling (cyan) but shows a much broader expression domain than HA labeling. h Most HA-positive neurons are located in the dorsal part of the rhombencephalic ventricle (RV). The ventricle is outlined by Elavl3/4 labeling (white). i Some HA-positive neurons are located within the periventricular gray zone (PGZ, white arrowheads). Many HA-labeled neurons are located at the margin of the PGZ and the optic tectum (TeO, yellow arrowhead). Elavl3/4 labeling marks most cells of the PGZ. j High magnification of the diencephalic ventricular zone showing co-expression of HA (cyan) and endogenous Elavl3 (magenta) within the population of Elavl3/4-positive neurons (green). k Overlapping expression of HA, Elavl3 and Elavl3/4 in the dorsal habenula. l Ventrally located nucleus in the hypothalamus shows that all Elavl3-positive neurons co-express HA-Uprt-mCherry (white arrowhead and inset). Cartoons in a-d and i show lateral views of adult zebrafish brain indicating the level of the individual cross sections. e-g and i. Sections show a similar level as in a or c, respectively. The panels j′, j′′, j′′′, k′, k′′, k′′′ and l′, l′′, l′′′ show single channels. Scale bars represent 100 µm in a; 40 µm in b, g; 150 µm in c; 45 µm in d, h; 25 µm in e, f; 35 µm in i; 20 µm in h, k; and 30 µm in l |
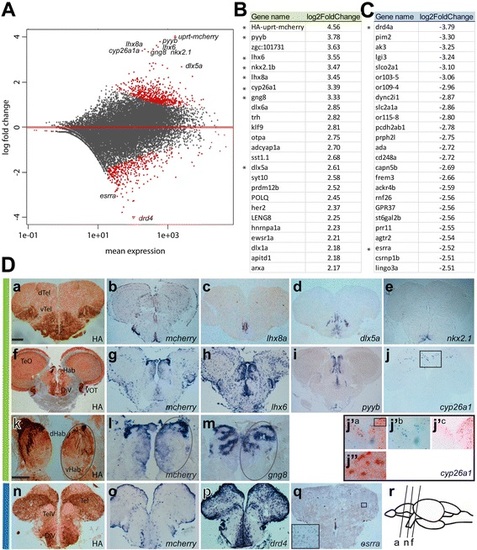
Data analysis and verification of 4tU-labeled mRNA isolated from adult zebrafish brain. a Distribution plot showing the log fold change of individual reads compared to the mean expression using DESeq2. The red dots indicate significantly enriched or depleted genes (padj < 0.1). Some labeled enriched or depleted genes were analyzed for their expression pattern (see d). b List of the most-enriched genes (green) and (c) most depleted genes (blue) and their log2-fold change compared to total mRNA expression levels. Asterisks mark genes used for expression studies. d Cross sections of transgenic adult zebrafish brains labeled with HA labeling (a, f, k, n) or in situ probes of enriched genes (b-e, g-j, l, m green bar) as indicated on each image. j′a-c and j′′ are higher magnifications of boxes shown in j and j′, respectively. j′b and j′c show cyp26a1 in situ hybridization and HA IHC labeling, respectively. j′a and j′′ show cyp26a1 in situ hybridization and HA IHC labeling. Expression of depleted genes (p,q, blue bar). Cartoon (in r) showing the corresponding sections in a, f and n. dTel, dorsal Telencephalon, vTel, ventral Telencephalon, Hab, habenula, dHab, dorsal Hab, vHab, ventral Hab, TeO, optic tectum, DiV, diencephalic ventricle, VOT, ventrolateral optic tract, TelV, telencephalic ventricle. Scale bars represent 100 µm in da-j, n,q and 65 µm in dk-m |
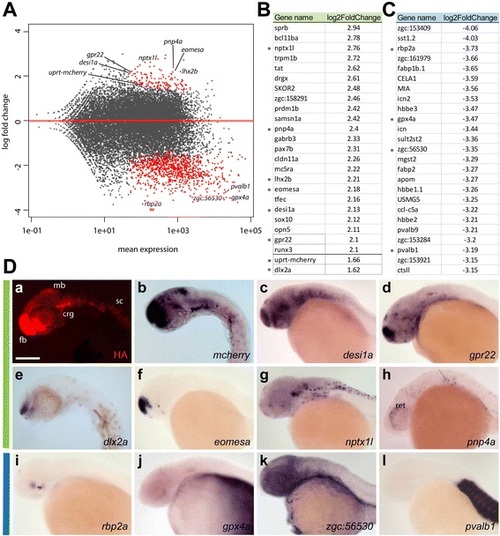
Data analysis and expression patterns of 4tU-labeled mRNA transcripts isolated from whole embryos. a Distribution plot showing the log fold change of individual reads compared to the mean expression using DESeq2. The red dots indicate significantly enriched or depleted genes. b List of the top enriched (green) and (c) depleted (blue) genes and their log2-fold change compared to total mRNA expression levels. Genes used for expression study are marked with asterisks. In addition uprt-mcherry and dlx2a are shown to demonstrate enrichment for the transgene and a gene common with adult purified mRNA, respectively. d In situ hybridization of 24–26 hpf embryos, lateral view showing enriched (b-h, green bar) or depleted genes (i-l, blue bar). dc,d,f-l show images published by The Zebrafish Model Organism Database (ZFIN) [47,48]. fb, forebrain, mb, midbrain, crg, cranial ganglia, sc, spinal cord. Scale bar represents 100 µm |