
- Title
-
Direct In Vivo Manipulation and Imaging of Calcium Transients in Neutrophils Identify a Critical Role for Leading-Edge Calcium Flux
- Authors
- Beerman, R.W., Matty, M.A., Au, G.G., Looger, L.L., Choudhury, K.R., Keller, P.J., Tobin, D.M.
- Source
- Full text @ Cell Rep.

Calcium Is Enriched at the Leading Edge of Migrating Neutrophils In Vivo (A) Illustration of a caudal fin amputation (red dotted line) in a double-transgenic larva Tg(LysC:GCaMP3; LysC:dsRed) with the field of view in the red box. White arrow indicates fin amputation, and white box highlights the neutrophil in the still frames in (B). Scale bar, 50 µm. (B) Maximum-intensity projections from time-lapse experiments with light-sheet fluorescence microscopy follow a single neutrophil migrating toward wound, displaying image data from each channel (GCaMP3 or dsRed) and resulting ratiometric image (GCaMP3/dsRed). Arrow indicates overall direction of migration. t = 0 corresponds to 40 min post-wounding. Scale bar, 10 µm. (C) Time-averaged calcium activity profile across the length of a migrating neutrophil (normalized relative to direction of migration, where 0 is the lagging edge and 100 is the leading edge). Each neutrophil is graphed in black (n = 15, from four animals) with the mean profile (red line), bound by 95% confidence intervals (dashed red lines). (D) Left box plot shows the difference between the average calcium signal at the leading and lagging edge (one-fifth of the length) for each neutrophil examined in (C). Middle line is the median, the box is the middle 50%, and the upper and lower bars indicate data range, with outliers as dots. Calculations were also repeated using the leading and lagging one-third of each cell (right box plot). Hypothesis that the average difference was positive was tested using a one-sample t test. See also Figures S1–S3 and Movie S1. |

Neutrophils Undergo Whole-Cell Calcium Flux at Sites of Injury and upon Phagocytosis of Bacteria (A) Cartoon of a ventral fin wound (red notch) and field of view during imaging (red square). (B) Fluorescent images from a time-lapse following GCaMP3 expression in a neutrophil migrating toward a ventral fin wound in a Tg(LysC:GCaMP3) larva. t = 0 corresponds to 5 min post-wounding. Arrow highlights a single neutrophil as it periodically flashes during migration toward a ventral wound. (C) Mean number of whole-cell calcium flashes per cell per minute during the first hour post-wounding in migrating neutrophils and stationary neutrophils. Error bars are mean ± SD. Mann-Whitney test p < 0.0001 (n = 15 cells from five larvae for migrating cells, and n = 8 cells from four larvae for stationary cells). (D) Still frames from time-lapse capturing calcium flash upon LysC:GCaMP3 neutrophil (green) phagocytosis of P. aeruginosa (red). Dotted line surrounds the phagocytic neutrophil in each frame, and the arrow highlights bacteria that will be phagocytosed. t = 0 corresponds to 30 min post-infection. Scale bars, 10 µm. Graphs quantify the increase in relative fluorescence intensity from GCaMP3 (F/F0) during phagocytosis of PAO1. Left graph corresponds to the panels above, and the center and right graphs correspond to additional examples shown in Movie S2, parts 3 and 4, respectively. See also Movie S2. |

Regulated Calcium Flux Is Required for Neutrophil Recruitment (A and B) Time-lapse experiment shows no change in GCaMP3 fluorescence in neutrophils from control Tg(LysC:dsRed; LysC:GCaMP3) larva after addition of capsaicin and increased GCaMP3 fluorescence in neutrophils from Tg(LysC:rTRPV1; LysC:GCaMP3) larva. (A) Selected still frames show GCaMP fluorescence in Tg(LysC:rTRPV1; LysC:GCaMP3) larva during extended exposure to capsaicin. t = 0 corresponds to 5 min after addition of capsaicin. Scale bar, 20 µm. (B) Quantification of the relative GCaMP fluorescence intensity (F/F0) during extended capsaicin treatment (n = 5 neutrophils for each larva). Error bars are mean ± SD. See also Movie S3. (C–F) Tg(LysC:rTRPV1; LysC:GCaMP3) or Tg(LysC:dsRed; LysC:GCaMP3) larvae were wounded (C and D) or infected with P. aeruginosa in the hindbrain (E and F) and briefly pulsed with capsaicin (CAP) or soaked in ethanol (EtOH) for 2 hr before neutrophil recruitment was quantified. Recovery Tg(LysC:rTRPV1; LysC:GCaMP3) larvae were pulsed with CAP before wounding, followed by EtOH soak for 2 hr to assess neutrophil recovery after capsaicin treatment (C and D). (C) Representative maximum-intensity projections show red-fluorescent neutrophils merged with bright field at 2 hr post-wounding. (E) Representative maximum-intensity projections show red-fluorescent neutrophils and green-fluorescent P. aeruginosa at 2 hr post-infection within the hindbrain ventricle outlined by white dashed line. Scale bars, 100 µm. (D and F) Graphs display the number of neutrophils recruited for each larva. Error bars are mean ± SD. Kruskal-Wallis test followed by Dunn’s multiple comparison test: , adjusted p < 0.0001; , adjusted p = 0.0002; and , adjusted p = 0.014. Each experiment was carried out at least twice. |

A Capsaicin Gradient Directs rTRPV1-Neutrophil Motility (A) Injecting capsaicin (red) into surrounding agarose generates an intracellular calcium gradient (green) in neutrophils expressing rTRPV1 channels (blue lines). R indicates the reference point, defined as the initial point source of the gradient. Three experimental groups were imaged: Tg(LysC:dsRed; LysC:GCaMP3) larvae in a capsaicin gradient (dsRed+CAP), Tg(LysC:rTRPV1; LysC:GCaMP3) larvae in an ethanol gradient (rTRPV1+EtOH), or capsaicin gradient (rTRPV1+CAP). (B) Last frames from Movie S4 show the tracks of individual neutrophils from each experimental group (quantified in D and E) relative to the reference point R at the focal point of the gradient. (C) (x,y) coordinates for each neutrophil at every frame tracked within the Tg(LysC:rTRPV1) larvae exposed to a capsaicin gradient visually illustrate the directed motion toward the source. The track for each cell was normalized such that the starting (x,y) position was (0,0) for every cell. All units are µm. One larva from the rTRPV1 + CAP group was assessed after exposure to a ventrally centered gradient along the bottom of the animal and the three tracked cells from that animal are highlighted with red arrows. (D and E) Graphs show the final distance traveled toward the reference point (D), and straightness ratio (E) for tracked neutrophils. Error bars are mean ± SD. (D) Kruskal-Wallis test followed by Dunn’s multiple comparison test: , adjusted p = 0.012 and , adjusted p value = 0.0075. (E) One-way ANOVA followed Tukey’s multiple comparisons test: , adjusted p value = 0.0052 for dsRed+ CAP versus rTRPV1+CAP and , adjusted p value = 0.005 for rTRPV1+ EtOH versus rTRPV1+CAP. For each group, n e 30 cells from e10 larvae. See also Figure S4 and Movie S4. |

Inhibition of Calcium Channels Disrupts Neutrophil Directionality during Recruitment (A–D) After caudal fin amputation, Tg(LysC:GFP) or Tg(LysC:dsRed) larvae were immediately treated with vehicle alone (control) or 20 µM SKF 96365 (SKF), followed by quantification of neutrophil recruitment 3 hr post-wounding (A and B). (A) Error bars are mean ± SD. Mann-Whitney test p < 0.0001. (B) Groups of larvae were placed in control treatments for 10, 20, or 30 min before replacement of media with SKF for the remainder. Error bars are mean ± SD. One-way ANOVA followed by Tukey’s multiple comparisons test p < 0.001. Each experiment was carried out at least twice. (C and D) Immediately after wounding, larvae were mounted in agarose, immersed with either control or SKF, then imaged with time-lapse microscopy. (C) For the neutrophils tracked, graphs show their total distance traveled, average velocity, and straightness ratio. Total distance and straightness ratio error bars are mean ± SD, and average velocity error bars are mean ± SEM. t test, p = 0.0002. For each group, n = 8 cells from two to three larvae. (D) Final frames from Movie S5 show the tracks of individual neutrophils (quantified in C) near the amputated fin (approximated by the white line). See also Movie S5. |
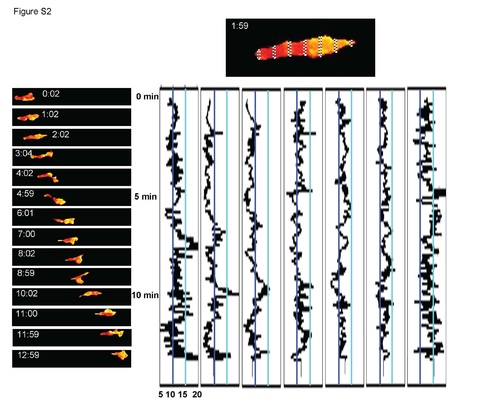
(Relates to Figure 1). Detailed analysis of calcium activity profile from a migrating neutrophil. The top image of a cell illustrates how the boxes L=4, 20, 36, 52, 68, 84, and 100 from Figure S1 were rotated, stretched, and magnified to highlight the enriched calcium flux at the leading edge, and to a lesser extent the lagging edge over time. The y axis is time (min) and the x axis is the GCaMP3/dsRed ratio oriented such that the turquoise line shows a visual threshold of the ratio at 15 and the dark-blue line shows a visual threshold of the ratio at 10. The time-lapse ratiometric cell images on the left correspond approximately to the time axis on the calcium activity profiles to provide a visual readout of the quantified signal graphed adjacently. |

(Relates to Figure 1). Stationary neutrophils do not exhibit a distinguishable pattern of calcium localization. (A) Still frames from time-lapse microscopy show a stationary neutrophil in a Tg(LysC:GCaMP3; LysC:dsRed) larva after a caudal fin wound. Each channel was captured sequentially (GCaMP3 or dsRed) and the resulting ratiometric image is GCaMP3/dsRed. t=0 corresponds to approximately 40 min post wounding. The scale bar is 10µm. (B) Summary graph displays the time-averaged calcium activity profile across the length of a stationary neutrophil (normalized to 100 units at each frame; 0 is edge most distal to wound and 100 is edge most proximal to the wound). Each individual neutrophil is graphed in black (n=11 from 5 animals) with the average profile outlined in red and bound by the 95% confidence intervals (dashed red lines). (C) Calcium activity profiles from stationary neutrophil in (A). The stationary cell was sectioned into 25 parts across its length (1-100 units), such that L=4 (the upper left hand box) displays the average GCaMP3/dsRed signal (y axis) across time (x axis, minutes) within the left-most (distal to wound) edge of the cell and L=100 corresponds to the right-most (proximal to wound) edge of the stationary cell.
|