
- Title
-
The Ribosome Biogenesis Protein Nol9 Is Essential for Definitive Hematopoiesis and Pancreas Morphogenesis in Zebrafish
- Authors
- Bielczyk-Maczyńska, E., Lam Hung, L., Ferreira, L., Fleischmann, T., Weis, F., Fernández-Pevida, A., Harvey, S.A., Wali, N., Warren, A.J., Barroso, I., Stemple, D.L., Cvejic, A.
- Source
- Full text @ PLoS Genet.
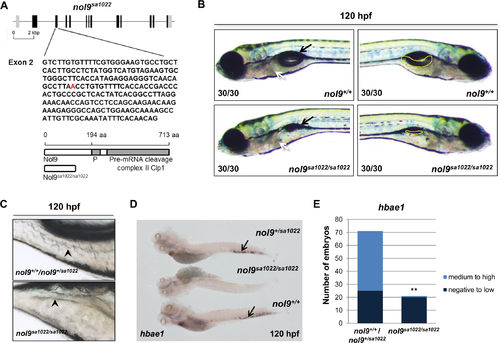
Loss-of-function nol9 mutation leads to defects in the development of the intestine, liver, pancreas and definitive erythrocytes in zebrafish. (A) Schematic representation of the nol9 gene and protein. Vertical bars represent exons (black boxes) and UTRs (grey boxes). The nonsense point mutation in nol9sa1022 is marked in red. Wild-type Nol9 protein and its expected truncated version resulting from the nol9sa1022 allele are shown. Domains of the Nol9 protein are indicated by grey boxes. P—P-loop NTP-ase domain. (B) Representative DIC images of nol9+/+ and nol9sa1022/sa1022 larvae at 120 hpf. Left and right sides of each larva are shown. White arrow points to the liver. Black arrow shows the swim bladder. Pancreas is outlined in yellow. (C) Representative bright filed images of the intestinal folds at 120 hpf. The nol9sa1022/sa1022 mutant larvae have less developed intestinal folds (black arrowhead) compared to nol9+/+ siblings. (D) Whole-mount in situ hybridization using hbae1 riboprobe at 120 hpf. Arrow indicates hbae1-positive definitive erythrocytes present in the CHT of nol9+/sa1022 and nol9+/+ but not nol9sa1022/sa1022 embryos. (E) Quantification of hbae1 in situ hybridization data. Data are represented as the number of larvae belonging to each phenotypic group. Fisher’s exact test, **, p<0.01. |
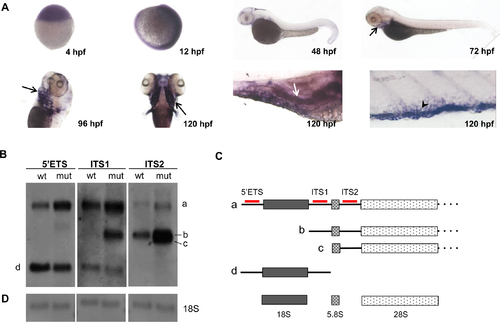
Loss-of-function nol9 mutation leads to a defect in ITS2 pre-rRNA processing. (A) Expression pattern of nol9 by WISH at sphere stage (4 hpf), 12 hpf, 48 hpf, 72 hpf, 96 hpf and 120 hpf. Black arrows indicate branchial arches, white arrow indicates pancreas and arrowhead indicates nol9-expressing cells in the CHT. (B) Representative Northern blot analysis of RNA isolated from 5 dpf nol9sa102/sa10222 mutants and control (nol9+/+ and nol9+/sa1022) siblings using 5’ETS, ITS1 and ITS2 probes to detect rRNA processing intermediates. Corresponding rRNA intermediates (a, b, c, d) are indicated in B) and C). (C) Schematic representation of the rRNA intermediates detected in the Northern blot analysis. The sites of hybridization of the 5’ETS, ITS1 and ITS2 probes are indicated in red. (D) Methylene blue staining of the membrane was used to control for equal loading of RNA. wt–nol9+/+/nol9+/sa1022, mut–nol9sa1022/sa1022. |
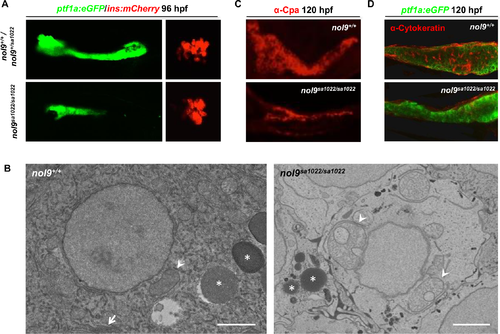
nol9 mutation affects the development of the exocrine but not the endocrine pancreas. (A) Representative single channel confocal images of the pancreas of 96 hpf Tg(ptf1a:EGFP;ins:mCherry) larvae. nol9sa1022/sa1022 larvae were characterized by smaller ptf1a-positive area (green) and similar ins-positive area (red) compared to nol9+/+ siblings. (B) TEM pictures of the exocrine pancreas of nol9+/+ and nol9sa1022/sa1022 larvae at 120 hpf. The white arrow denotes endoplasmic reticulum in the nol9+/+ cell. Asterisks indicate zymogen granules. Arrowheads indicate mitochondria. Scale bar: 2 μm. (C-D) Confocal images of the pancreas of Tg(ptf1a:EGFP) larvae subjected to immunohistochemistry against α-Carboxypeptidase-a (α-Cpa) (C) and α-Cytokeratin (D) at 120 hpf. (C) The exocrine pancreas differentiation marker α-Cpa (red) was detected in nol9+/+ and nol9sa1022/sa1022 siblings. (D) The pancreatic ducts expressing α-Cytokeratin (red) are not apparent in nol9sa1022/sa1022 mutants, in contrast to the ductal network clearly visible in nol9+/+ siblings. |

nol9sa1022/sa1022 mutants show a decrease in the number of lymphocytes and HSPCs. A) Whole-mount in situ hybridization with lymphocyte-specific rag1 probe (arrowhead) revealed that nol9sa1022/sa1022 larvae displayed weak to medium rag1 expression at 96 hpf, compared to medium to strong signal in nol9+/+ or nol9+/sa1022 siblings. Larvae are oriented anterior to the top and ventral up. (B) The number of larvae displaying different degrees of rag1 expression as assessed by WISH. Data are represented as the number of larvae belonging to each phenotypic group. Fisher’s exact test, ** p<0.01. (C) Whole-mount in situ hybridization against the thymic epithelium marker foxn1 at 96 hpf revealed a similar level of signal (arrow) in nol9+/+ and nol9sa1022/sa1022 siblings. (D) Whole-mount in situ hybridization using a c-myb riboprobe was used to assess the number of HSCs emerging in the AGM region at 36 hpf (arrow) and the number of HSPCs in the CHT (arrow) at 72 hpf. Representative pictures of the AGM region (36 hpf) and the CHT (72 hpf) are shown. Mutant nol9sa1022/sa1022 embryos displayed normal c-myb signal at 36 hpf and decreased c-myb signal at 72 hpf compared to wt siblings. Fisher’s exact test, **, p<0.01. All embryos are oriented with anterior to the left and dorsal to the top. Numbers represent embryos with the displayed phenotype out of the total number of embryos examined. PHENOTYPE:
|
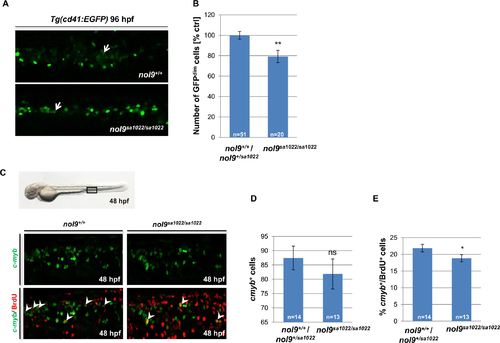
nol9sa1022/sa1022 mutants show a decrease in proliferation of c-myb+ cells. (A) Representative maximum projection confocal images showing HSPCs (GFPdim, arrow) in the CHT of Tg(cd41:EGFP) larvae at 96 hpf. Larvae are oriented with anterior to the left and dorsal to the top. (B) The number of GFPdim HSPCs observed in the CHT region of nol9sa1022/sa1022 mutants (n = 20) and their wt siblings (n = 51) at 96 hpf. Data are represented as the mean +/- SEM, Student’s t-test, **, p<0.01. (C) Representative confocal images of the CHT of Tg(cmyb:EGFP) embryos subjected to BrdU incorporation assay at 48 hpf. Arrowheads mark double positive BrdU+ c-myb+ cells. Bright field image of a 48 hpf embryo shows the imaged part of the CHT. (D) The total number of c-myb+ cells observed in the CHT of nol9sa1022/sa1022 embryos (n = 13) and their wt siblings (n = 14) subjected to the BrdU incorporation assay at 48 hpf. Data are represented as the mean +/- SEM. Student’s t-test. ns—not significant. (E) The percentage of BrdU+ cells within the c-myb+ population in the CHT of nol9sa1022/sa1022 embryos (n = 13) and their wt siblings (n = 14) subjected to the BrdU incorporation assay at 48 hpf. Data are represented as the mean +/- SEM, Student’s t-test, *, p<0.05. |

Ultrastructural studies of caudal hematopoietic tissue (CHT) in nol9sa1022/sa1022 larvae. (A) Schematic representation of a transversal section in the CHT region of a 120 hpf zebrafish, dorsal up. NT–neural tube, NC–notochord, M—myotome, CA–caudal artery, CHT–caudal hematopoietic tissue, CV–caudal vein. (B-C) A low-magnification TEM image of the CHT from a nol9+/+ (B, n = 2) and nol9sa1022/sa1022 (C, n = 2) larvae. Dashed line denotes the width of the CHT. Arrowheads denote mitochondrial profiles visible within myotomes (M). Asterisks denote extracellular matrix (ECM). (D-E) High magnification TEM image of cells present in the CHT of nol9+/+ (D) and nol9sa1022/sa1022 (E) larvae. (F-G) High magnification TEM image of endothelial cells in the caudal vein of nol9+/+ (F) and nol9sa1022/sa1022 (G) larvae. Arrow denotes vesicles visible in the cytoplasm of the endothelial cell, reminiscent of lipofuscin. E–endothelium. Scale bars: 2 μm. PHENOTYPE:
|
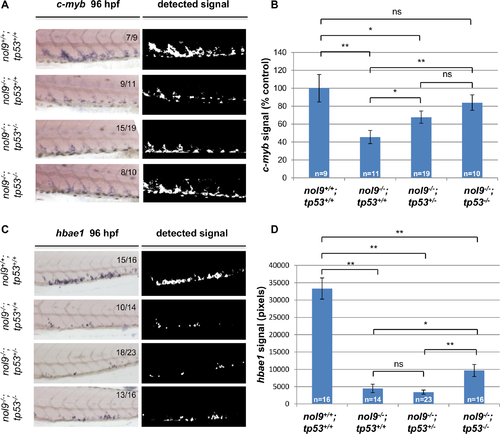
The number of HSPCs is rescued in a tp53 mutant background. (A) The CHT of 96 hpf larvae from a nol9+/sa1022;tp53+/zdf1 x nol9+/sa1022;tp53+/zdf1 cross stained by WISH against c-myb. Signal extracted from the corresponding WISH photograph is shown. Numbers represent larvae with the displayed phenotype out of the total number of larvae examined. (B) Quantification of c-myb in situ signal for 96 hpf larvae from a nol9+/sa1022;tp53+/zdf1 x nol9+/sa1022;tp53+/zdf1 cross, depending on their genotype. Data are represented as the mean number of pixels +/- SEM. nol9+/+;tp53+/+ n = 9; nol9-/-;tp53+/+ n = 11; nol9-/-;tp53+/zdf1 n = 19; nol9-/-; tp53zdf1/zdf1 n = 10. Two-tailed Student’s t-Test, *, p<0.05; **, p<0.01. (C) Representative pictures of the CHT of 96 hpf larvae from a nol9+/sa1022;tp53+/zdf1 x nol9+/sa1022;tp53+/zdf1 cross stained by WISH against hbae1. Signal extracted from the corresponding WISH photograph is shown. (D) Quantification of hbae1 WISH signal for larvae from a nol9+/sa1022;tp53+/zdf1 x nol9+/sa1022;tp53+/zdf1 cross, depending on their genotype. Data are represented as the mean number of pixels +/- SEM. nol9+/+;tp53+/+ n = 16; nol9-/-;tp53+/+ n = 14; nol9-/-;tp53+/- n = 23; nol9-/-;tp53-/- n = 16. Two-tailed Student’s t-Test, *, p<0.05; **, p<0.01. Within the figure, nol9sa1022 allele has been denoted as nol9- and tp53zdf1 as tp53-. |
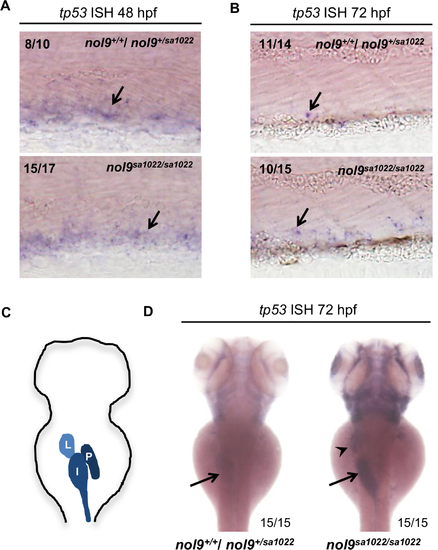
nol9sa1022/sa1022 embryos display tissue-specific upregulation of tp53. Representative images of embryos stained by whole-mount in situ hybridization against tp53. (A) At 48 hpf, similar levels of tp53 signal (arrow) was detected in the CHT of nol9sa1022/sa1022 embryos and their wild-type siblings. (B) At 72 hpf, nol9sa1022/sa1022 mutant embryos were characterized by more tp53 signal in the CHT than their wt siblings. Mann-Whitney U test, p<0.05. (A-B) All embryos are oriented with anterior to the left and dorsal to the top. (C) Schematic representation of digestive organs in a wild-type 72 hpf zebrafish larva. I–intestine, L- liver, P- pancreas. (D) At 72 hpf, nol9sa1022/sa1022 mutant embryos display strong tp53 signal in the liver (arrowhead) and intestine (arrow), compared to weak signal in the intestine of wild-type siblings. (C-D) Dorsal view anterior up. EXPRESSION / LABELING:
PHENOTYPE:
|
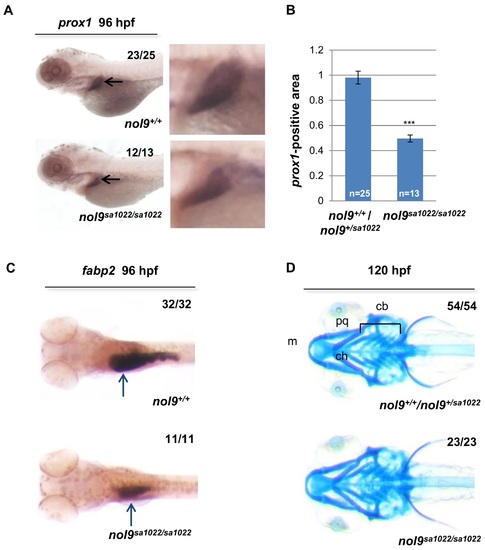
nol9 mutation affects the development of liver and intestine but not of jaw cartilage. (A) Representative pictures of 96 hpf larvae stained by WISH against the liver marker prox1 (black arrow). Magnified images of the liver are shown. (B) Quantification of the prox1 in situ hybridization data. The average prox1-positive area is decreased in nol9sa1022/sa1022 mutants (n = 13) compared to wild-type siblings (n = 25). Data are represented as the average +/- SEM. Two-tailed Student’s t test, ***, p<0.001. (C) Representative images of 96 hpf larvae stained by WISH against the intestinal marker fabp2a. The expression of fabp2a (blue arrow) is decreased in nol9sa1022/sa1022 (n = 11) compared to wild-type siblings (n = 32). (D) Alcian blue staining, showing normal formation of the jaw cartilage elements Meckel’s (m), palatoquadrate (pq), ceratohyal (ch) and ceratobranchial (cb) in both nol9sa1022/sa1022 mutants (n = 23) and wt siblings (n = 54) at 120 hpf. Ventral view with anterior to the left. |

Definitive, but not primitive erythropoiesis is affected in nol9sa1022/sa1022 mutants. (A-D) o-Dianisidine staining of circulating erythrocytes at 48 hpf, 96 hpf and 120 hpf. (A) Representative images of o-Dianisidine-stained embryos at 48 hpf. The level of staining was similar between nol9+/+ (n = 13), nol9+/sa1022 (n = 35) and nol9sa1022/sa1022 (n = 8) embryos. Ventral view with anterior up. (B) Representative images of o-Dianisidine-stained larvae at 96 hpf. The number of stained circulating primitive erythrocytes was comparable between nol9sa1022/sa1022 (n = 10), nol9+/+ (n = 15) and nol9+/sa1022 (n = 15) siblings. Ventral view with anterior up. (C) Quantification of the area stained in o-Dianisidine-stained larvae area at 96 hpf. Data are represented as average +/- SEM. Two-tailed Student’s t test, p>0.05. ns–not significant. (D) Representative images of o-Dianisidine-stained larvae at 120 hpf. All nol9sa1022/sa1022 (n = 20), nol9+/+ (n = 2) and nol9+/sa1022 (n = 8) larvae displayed a similar level of staining. Larvae oriented with anterior to the left and dorsal to the top. (E) Whole-mount in situ hybridization using hbae1 riboprobe at 96 hpf. Arrows indicate hbae1-positive definitive erythrocytes present in the CHT of nol9+/sa1022 and nol9+/+ but not in nol9sa1022/sa1022 larvae. (F) Quantification of hbae1 in situ hybridization data. Data are represented as the number of larvae belonging to each phenotypic group. Fisher’s exact test, **, p<0.01. |

nol9sa1022/sa1022 mutants have a defect in development of the exocrine but not the endocrine pancreas. (A) Representative confocal images of the pancreas of Tg(ptf1a:EGFP;ins:mCherry) fish at 48-, 72- and 120 hpf. No difference was observed between nol9sa1022/sa1022 and wt siblings at 48- and 72 hpf. At 120 hpf the area of the ptf1a+ exocrine pancreas (green) was decreased in nol9sa1022/sa1022 larvae, while the area of ins+ endocrine pancreas (red) was comparable in nol9sa1022/sa1022 mutants and wt siblings. (B) Confocal images of the endocrine pancreas of larvae subjected to immunohistochemistry against Somatostatin and Glucagon at 96 hpf. The intensity and area covered by the signal was comparable in nol9sa1022/sa1022 larvae and wt siblings for both antibodies. (C) Average volume of the ptf1a-positive exocrine pancreas in nol9sa1022/sa1022 (n = 8) and wt (n = 15) larvae at 120 hpf. Data are represented as the mean +/- SEM, Student’s t-test, **, p<0.01. All images are oriented with anterior to the right and dorsal to the top. |

Gene knockdown studies using nol9 morpholino confirm the pancreas phenotype observed in nol9sa1022/sa1022 mutants. (A) General morphology of 96 hpf larvae injected with either standard control morpholino (std MO) or a morpholino targeting the translational start site of the nol9 transcript (nol9 ATG MO). Numbers represent larvae with the displayed phenotype out of the total number of larvae examined. (B) Representative confocal images of the pancreas of 96 hpf Tg(ptf1a:EGFP;ins:mCherry) larvae injected with std MO or nol9 ATG MO. While the ptf1a+ exocrine pancreas appeared smaller in larvae injected with nol9 ATG MO compared to std MO, the ins+ endocrine pancreas was comparable between the groups. (C) The average volume of the ptf1a+ exocrine pancreas in 96 hpf larvae injected with std MO (n = 19) or nol9 ATG MO (n = 25). Data are represented as the mean +/- SEM, Student’s t-test, **, p<0.01. |

Formation of secondary islets and apoptosis levels in pancreas are unaffected in nol9sa1022/sa1022 mutants. (A) Representative confocal images of the pancreas of 120 hpf Tg(ptf1a:EGFP;ins:mCherry) larvae showing the presence of ins-expressing secondary islets (arrow) in nol9sa1022/sa1022 mutants and wt siblings. (B) The percentage of Tg(ptf1a:EGFP;ins:mCherry) larvae whose pancreas contained secondary islets, depending on their genotype and previous treatment with either DAPT inhibitor or DMSO (vehicle control) at 120 hpf. The total number of larvae in each group is indicated. (C) Representative confocal images of Tg(ptf1a:EGFP) larvae subjected to TUNEL assay at 96 hpf and co-stained with DAPI. No TMR-labelled apoptotic cells were observed in the ptf1a-expressing exocrine pancreas of nol9sa1022/sa1022 mutants (n = 8) or their wt siblings (n = 9). However, the tails of nol9sa1022/sa1022 mutants and wt siblings contained similar numbers of apoptotic cells (arrow). (D) The mean number of apoptotic cells in the tails of nol9sa1022/sa1022 mutants (n = 8) and wt siblings (n = 9). Data are represented as the mean +/- SEM; Student’s t-test, ns–not significant. |

Proliferation of exocrine pancreas cells in nol9sa1022/sa1022 mutants. (A) Representative confocal images of Tg(ptf1a:EGFP) larvae subjected to BrdU incorporation assay at 96 hpf. Double positive ptf1a+ BrdU+ cells are indicated with arrows. Images are oriented with anterior to the right and dorsal to the top. (B) Average number of ptf1a+ cells which incorporated BrdU, normalized to the volume of ptf1a+ exocrine pancreas, in nol9sa1022/sa1022 (n = 9) and wt (n = 7) larvae at 96 hpf. Data are represented as the mean +/- SEM. Student’s t-test, p = 0.051. |

The number of thrombocytes and neutrophils is unaffected in nol9sa1022/sa1022 mutants. (A) Representative maximum projection confocal images showing thrombocytes (GFPbright, arrow) and HSPCs (GFPdim, arrowhead) in the CHT of Tg(cd41:EGFP) larvae at 96 hpf. Larvae are oriented with anterior to the left and dorsal to the top. (B) The number of GFPbright thrombocytes observed in the CHT region of nol9sa1022/sa1022 mutants (n = 20) and their wt siblings (n = 51) at 96 hpf. Data are represented as the mean +/- SEM; Student’s t-test, p>0.05. (C) Images of the CHT region of 72 hpf larvae stained with Sudan Black B. Stained neutrophils are marked by an arrow. (D) The average number of Sudan Black B-stained neutrophils in the CHT region of 72 hpf larvae, depending on their genotype (nol9+/+ n = 32, nol9+/sa1022 n = 32 and nol9sa1022/sa1022 n = 28). Data are represented as the mean +/- SEM; One-way ANOVA, ns–not significant. |
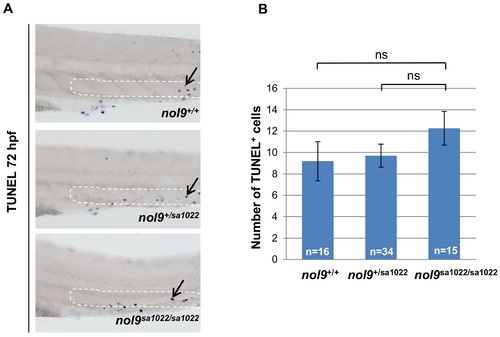
Apoptosis in the CHT assessed by TUNEL assay. (A) The CHT region of 72 hpf larvae stained with TUNEL assay. nol9sa1022/sa1022 mutants do not exhibit an increase in the number of TUNEL-positive apoptotic cells (arrow) compared to wt siblings in the CHT region (as outlined). All larvae are oriented with anterior to the left and dorsal to the top. (B) The average number of TUNEL-positive apoptotic cells in the CHT region in nol9+/+ (n = 16), nol9+/sa1022 (n = 34) and nol9sa1022/sa1022 (n = 15) larvae at 72 hpf. Data are represented as the mean +/- SEM; One way ANOVA, ns–not significant. |
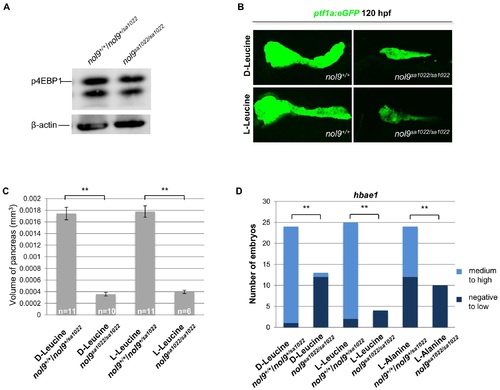
The pancreatic and hematological defects in nol9sa1022/sa1022 larvae are independent of the mTOR pathway. (A) Western blot analysis of p4EBP1 and β-actin (loading control) in whole cell lysates of nol9sa1022/sa1022 and wt siblings at 120 hpf. (B) Representative confocal images of the pancreas of Tg(ptf1a:EGFP) nol9sa1022/sa1022 and nol9+/+ larvae at 120 hpf after treatment with L-Leucine or D-Leucine from 24 hpf. (C) The average volume of the ptf1a-positive exocrine pancreas in 120 hpf Tg(ptf1a:EGFP) larvae, depending on their genotype and treatment with either D-Leucine or L-Leucine from 24 hpf. The data are represented as the mean +/- SEM. Student’s t-test, **, p<0.01. (D) Quantification of hbae1 WISH performed on 120 hpf larvae treated with D-Leucine, L-Leucine or L-Alanine from 24 hpf. Data are represented as the number of wt (nol9+/+/nol9+/sa1022) or mutant (nol9sa1022/sa1022) larvae belonging to either phenotypic group. Fisher’s exact test, **, p<0.01. |
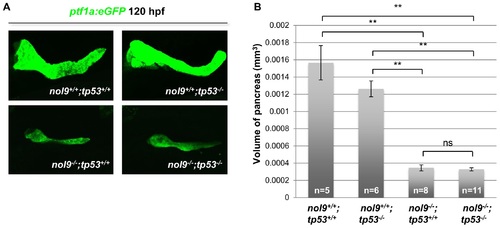
The exocrine pancreas phenotype of nol9sa1022/sa1022 mutants is independent of Tp53 signalling. (A) Confocal images of the pancreas of 120 hpf larvae from a Tg(ptf1a:EGFP);nol9+/sa1022;tp53+/zdf1 x nol9+/sa1022;tp53+/zdf1 cross. (B) The average volume of the ptf1a+ exocrine pancreas of 120 hpf larvae from a Tg(ptf1a:EGFP);nol9+/sa1022;tp53+/zdf1 x nol9+/sa1022;tp53+/zdf1 cross, depending on their genotype. Data are represented as the mean +/- SEM. Student’s t-test, **, p<0.01, ns–not significant. Within this figure, nol9sa1022 allele has been denoted as nol9- and tp53zdf1 as tp53-. |

Unillustrated author statements |