- Title
-
A Temporal Window for Signal Activation Dictates the Dimensions of a Nodal Signaling Domain
- Authors
- van Boxtel, A.L., Chesebro, J.E., Heliot, C., Ramel, M.C., Stone, R.K., Hill, C.S.
- Source
- Full text @ Dev. Cell
|
Expression of ta and fscn1a in the Margin Is Regulated by Fgf Signaling (A) Whole-mount immunofluorescence for phosphorylated Erk (P-Erk) in DMSO- and SB-505124-treated 50% epiboly embryos. DAPI labels the nuclei. (B) Western blot for P-Erk in pooled 50% epiboly embryos treated with indicated compounds. Actin is a loading control. (C) Western blot for P-Erk and total Erk in pooled 40%–50% embryos after control treatment or FgfR inhibition. Actin is a loading control. (D) WISH for ta, fscn1a, lft1, and lft2 in control embryos, embryos incubated with SU-5402, or embryos injected with mRNA encoding dnFgfR, at 40%–50% epiboly. For fscn1a, animal views are shown. Red brackets outline the width of the WT ta expression domain. (E) qPCR for indicated Nodal target genes on pooled 50% epiboly embryos treated with DMSO (D), SB-505124 (SB), or SU-5402 (SU). Depicted is the mean expression ± SD normalized to eef1a1l1 levels and compared with levels in DMSO-treated cells (p < 0.01, t test; n = 3). ns, not significant. (F) Western blot for P-Smad2 and Smad2 in pooled 40%–50% embryos treated with the indicated compounds. Mcm6 is a loading control. (G) Sections of DMSO- and SU-5402-treated 40%–50% epiboly embryos stained for ta. (H) Quantification of the number of cell tiers from the margin that express ta. Depicted is the mean ± SD (p < 0.01, Mann-Whitney U test; n > 50). See also Figure S1. |
|
The Tg(ARE:eGFP) Zebrafish Line Is a Sensitive and Specific In Vivo Nodal Reporter (A) Top: schematic representation of the Nodal reporter gene construct. Bottom: WISH for eGFP in Tg(ARE:eGFP) embryos at 50% epiboly (above, lateral view; below, animal view) and 22 somite stages. Dashed line indicates the midline. A, anterior; D, dorsal; lpm, lateral plate mesoderm; P, posterior; V, ventral. (B) WISH for eGFP in control-treated Tg(ARE:eGFP) embryos or after inhibition of Nodal signaling by SB-505124 from the 32-cell stage (left), injection of foxh1 MO (middle), or in a tdgf1-/- background (right) at 50% or 30% epiboly. For the tdgf1-/- experiment, a clutch of 16 embryos from a heterozygous incross was analyzed. Note that 25% of embryos lack eGFP staining. (C) qPCR for eGFP, ta, and odc1 on dissociated blastula-stage Tg(ARE:eGFP) embryonic cells. Depicted is the mean relative expression compared with untreated cells, normalized to eef1a1l1 levels from one representative experiment ± SD. (D) Polystyrene beads soaked in recombinant human NODAL were implanted into the animal pole of 1000-cell Tg(ARE:eGFP) embryos. Once the embryos had reached ring stage, they were stained for the indicated genes. Animal views are shown. A red spot indicates the position of the bead. (E) eGFP expression at 8-cell and 1,000-cell stages. (F) eGFP expression in sphere, 30% and 50% epiboly Tg(ARE:eGFP) embryos. Arrow indicates expression in dorsal cells. (G) Western blot for phosphorylated Smad2 (P-Smad2) in blastula stage embryos treated with or without SB-505124. Mcm6 is a loading control. See also Figures S2–S4. |
|
Extent of Nodal Signaling and Target Gene Expression in Tg(ARE:eGFP) Embryos (A) Sections of 40%–50% epiboly embryos, stained for eGFP, ndr1, ndr2, lft1, lft2, and sox3. Sections were counterstained with Nuclear Fast Red. The black line indicates the border of the YSL and blastoderm; arrowheads indicate five cell tiers. (B) Quantification of the number of cell tiers that express indicated Nodal target genes, calculated from the margin. Depicted is the mean number of cell tiers ± SD (n = 18). (C) Whole-mount immunofluorescence of 50% epiboly embryos for P-Smad2 and P-Erk. DAPI labels nuclei. Depicted is a single optical slice of a lateral view. (D) Immunofluorescence for P-Smad2 in DMSO- and SB-505124-treated 50% embryos. Depicted is a Z-projection of a lateral view. The white dashed line indicates the border of the margin. (E) Quantification of P-Smad2 immunofluorescence normalized to background signal as a function of the number of cell tiers from the margin in DMSO- and SB-505124-treated embryos. Data were binned in 15 µm intervals to represent the average size of a cell in 50% epiboly embryo (Dubrulle et al., 2015). Depicted are means of each bin obtained from multiple optical slices ± SEM (p < 0.0, t test, n = 3, comparing DMSO- and SB-505124-treated intensities for each cell tier). See also Figure S5. |
|
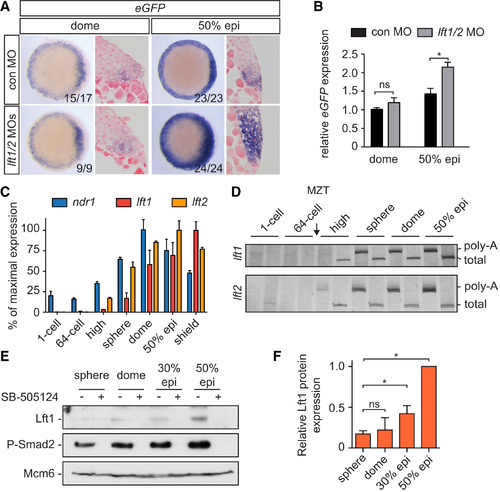
Delayed Translation of Lft1/2 Levels during Early Blastula Stages (A) WISH for eGFP in dome and 50% epiboly Tg(ARE:eGFP) embryos, injected with control or lft1/2 MOs. Animal views are shown at left, and ventrolateral sections are shown at right. (B) qPCR for eGFP mRNA on pooled dome and 50% epiboly embryos. Depicted are means ± SEM (p < 0.01, t test; n = 6). (C) qPCR for ndr1, lft1, and lft2 at different stages. The percentage of mean maximal expression ± SD from a representative experiment performed in triplicate is shown. (D) Extension poly-A test (ePAT) for lft1 and lft2 mRNA. Silver stained non-denaturing polyacrylamide gels are shown indicating total and polyadenylated (poly-A) mRNA. (E) Western blot showing protein expression of endogenous Lft1 and phosphorylated Smad2 in pooled, blastula-stage embryos. Treatment with SB-505124 is shown to confirm the Lft1 band. Mcm6 is a loading control. (F) Quantification of Lft1 protein expression from sphere to 50% epiboly. Depicted are the average band intensities of three independent blots, normalized to levels at 50% epiboly ± SD (p < 0.05, t test). See also Figure S6. |
|
Temporal Regulation of Lft1/2 Translation by miR-430s (A) WISH for pri-miR-430 at indicated stages. (B) WISH using LNA probes for mature miR-430a and miR-430b at 50% epiboly. (C) Northern blot for miR-430a and miR-430b at indicated stages using the same probes as in (B). mat, mature miRNA; pre, pre-miRNA. (D) Western blot for endogenous Lft1 and P-Smad2 in pooled, blastula-stage embryos injected with control or miR-430 MOs. Mcm6 is a loading control. epi, epiboly. (E) Lateral views of WISH for eGFP reporter and ndr1 in 30% epiboly, Tg(ARE:eGFP) embryos injected with MOs against lft1/2, miR-430 or both. (F) WISH for eGFP mRNA in 40% epiboly Tg(ARE:eGFP) embryos injected with control or combined lft1/2 and miR-430 MOs and treated with DMSO or SB-505124. Animal views are shown. See also Figure S7. |
|
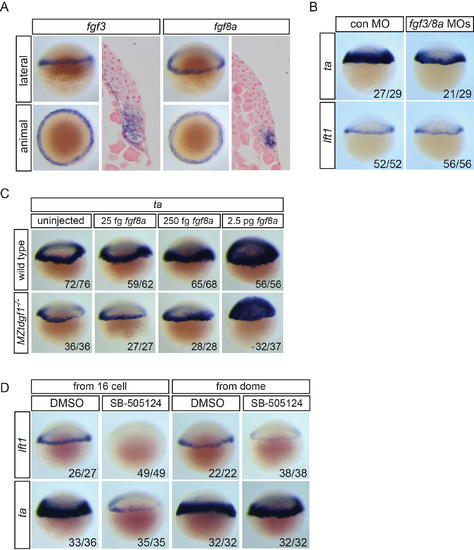
Fgf signaling inhibition and Nodal signaling (A) Expression of fgf3 and fgf8a in 40% epiboly embryos in the margin shown as WISH and sections. (B) ta and lft1 expression in 40% epiboly embryos injected with control MO or a combination of fgf3 and fgf8a MOs. (C) ta expression in wild type and maternal-zygotic (MZ) tdgf1-/- mutants. fgf8a mRNA (25 fg, 250 fg or 2.5 pg) was injected into wild type or MZtdgf1-/- mutant embryos, which were assayed by WISH for ta expression at 40% epiboly. ta is induced equally well in both backgrounds with 2.5 pg fgf8a mRNA. (D) lft1 and ta expression following inhibition of Nodal signaling with SB-505124 from the 16-cell or dome stage. When inhibited from dome stage, lft1 expression is severely reduced, whereas ta expression is unaffected. |
|
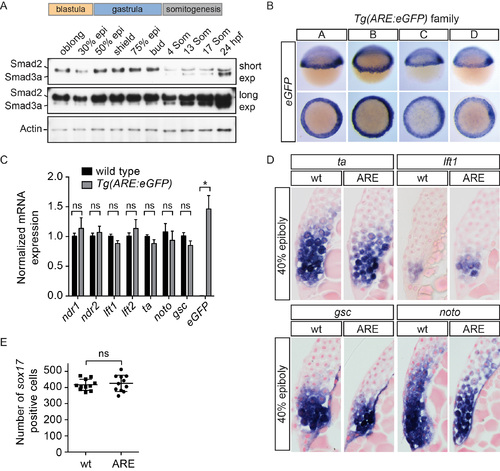
Generation of the Tg(ARE:eGFP) transgenic line (A) Western blot for Smad2 and Smad3a/b during development. Smad3a/b are not expressed at appreciable levels until somitogenesis stages, whereas Smad2 is expressed at all stages shown. A long and short exposure (exp) of the same blot is shown. Actin is a loading control. (B) WISH for eGFP in four Tg(ARE:eGFP) lines obtained from independent founders (labeled A–D). Note that individual lines differ slightly in strength of staining and background. (C) qPCR on pooled 40% epiboly wild type and Tg(ARE:eGFP) embryos for the indicated genes normalized to eef1a1l1. Means ± SEM are shown (* t-test: P < 0.05, n=5). ns, not significant. No significant differences were found for any of the genes tested, except eGFP. (D) Sections of WISH-stained 40% epiboly embryos. No differences were found in the extent of ta, lft1, gsc or noto (flh) staining between wild type and Tg(ARE:eGFP) embryos. Note that lateral sections are shown for ta and lft1, whilst dorsal sections are shown for gsc and noto. (E) Comparison of the number of sox17 positive cells in 75% epiboly wild type and Tg(ARE:eGFP) embryos. No significant difference was found between the number of endodermal cells between the two lines using a Mann-Whitney U test. In (D) and (E) wt, wild type; ARE, Tg(ARE:eGFP). |
|
Comparison of Nodal signaling activation in Tg(ARE:eGFP) embryos and expression of core components of the Nodal signaling pathway WISH for eGFP, ndr1 (sqt), ndr2 (cyc), acvr1ba (tar-a), tdgf1 (oep), smad2, foxh1 (sur), lft1 and lft2 in blastula and gastrula stage Tg(ARE:eGFP) embryos. |
|
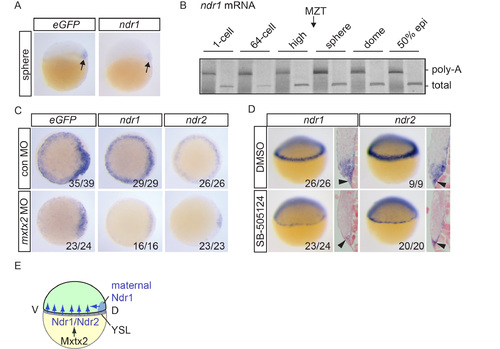
Initiation of Nodal signaling in Tg(ARE:eGFP) embryos (A) eGFP and ndr1 expression in sphere stage embryos. Arrows indicate dorsal expression domains. (B) ePAT for ndr1 mRNA. A silver-stained, non-denaturing polyacrylamide gel is shown indicating total and polyadenylated mRNA. Poly-A, polyadenylated; MZT, maternal to zygotic transition. (C) eGFP, ndr1 and ndr2 expression in dome stage Tg(ARE:eGFP) embryos injected with control (con) or mxtx2 MOs. Animal views are shown. (D) Lateral views and sections of 30-40% epiboly embryos treated with DMSO or SB- 505124 at the 32-cell stage and stained for ndr1 and ndr2 expression. Black arrowheads indicate expression in the YSL. (E) Schematic representation showing how Nodal signaling is initiated in zebrafish embryos. For details, see text. |
|
Extent of Nodal signaling in the margin (A) Double fluorescent WISH for eGFP and ndr2 in 30% epiboly (epi) embryos. (B) Z-projections of whole mount immunofluorescence for P-Smad2 in 50% epiboly embryos either treated with DMSO or SB-505124, which were used for quantification of Nodal signaling in the margin shown in (C) and (D). DAPI was used as a counter-stain. Note that embryo 3 in both cases are those shown in Figure 1A stained with P-Erk, which was performed as a double whole mount immunofluorescence with the P-Smad2. (C) Quantification of P-Smad2 staining intensity in DMSO- and SB-505124-treated embryos depicted in (B). Intensities are expressed as P-Smad2/DAPI ratios as a function of distance to the border of the margin. Distance is plotted on the x-axis and the dotted line indicates 90 µm, which corresponds to around six cell tiers. (D) As in (C) but with data binned in 15 µm bins. The black horizontal line represents the average intensity for each bin ± SD. |
|
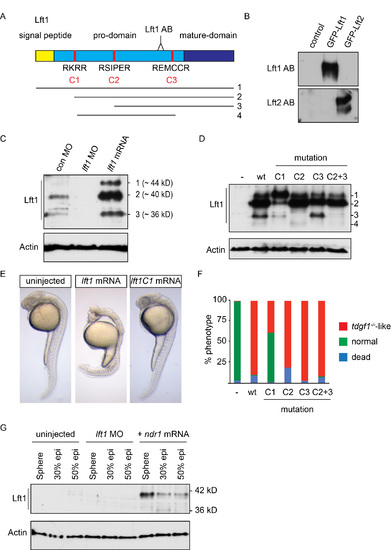
The Lft1 antibody recognizes the 40 kD cleaved and active Lft1 protein (A) Schematic representation of the zebrafish Lft1 protein. The Lft1 epitope is located in the pro-domain (light blue), just upstream of the mature ligand domain (dark blue). The Lft1 protein contains a signal peptide (gold) and three cleavage sites (C1-C3, red). The cleavage products (1–4) detected by SDS-PAGE are shown. AB, antibody (B) Western blot for in vitro reticulocyte-translated Lft1 and Lft2 using the cognate antibodies. Note that the Lft1 antibody recognizes GFP-Lft1, but not GFP-Lft2, and vice versa. (C) Western blot for endogenous and overexpressed Lft1 in pooled 50% epiboly embryo lysates. Overexpressed Lft1 runs as three bands at ~44, ~40, ~36 kD. The second band (~40 kD) corresponds to the main visible endogenous band. These bands are all absent when Lft1 is knocked down using a lft1 MO. (D) Western blot for wild type (wt) and mutant overexpressed Lft1 proteins in pooled zebrafish embryos. C1-C3 corresponds to mutated cleavage sites depicted in (A). An additional product (4) is seen in this experiment which results from cleavage at C1 and C3. Actin is a loading control. We conclude that the ~40 kD band arises from cleavage at C1. (E) Phenotype in 24 hpf wt embryos either uninjected or injected with 5 pg lft1 or lft1C1 mutated mRNA. Note that mutating the C1 site leads to rescue of the lft1 phenotype. (F) Quantification of phenotypes of 24 hpf embryos, injected with 5 pg wild type or mutant lft1 mRNAs. Assays were performed on at least 50 embryos. (G) Western blot for Lft1 in wild type embryos either uninjected or injected with lft1 MOs or ndr1 mRNA. Note that both the 40 kD and 36 kD bands are visible in ndr1-injected embryos and that the 40 kD band is barely visible in 50% epiboly uninjected embryos. |
|
Specificity of the miR-430 morpholinos (A) Phenotype of control (con) and miR-430 morpholino-injected embryos at 22 hpf. (B) WISH for miR-430a with an LNA probe after injection of a mix of miR-430 or control MOs. (C) qPCR for miR-430a, b and c after injection of control MOs (black bars) or miR-430 MOs (white bars). miR-30d was not affected by miR-430 morpholino injection. The data shown are means normalized to control MO ± SD (*** p-value < 0.001, t-test, n=6) (D) Western blot for GFP on pooled embryo lysates from uninjected embryos or embryos injected with 50 pg mRNA encoding GFP reporter constructs containing 3′UTRs for miR- 204 (3xPT-miR-204), miR-430 (3xPT-miR-430) or the lft2 3′UTR with either control MO or with miR-430 MOs. miR-430 MOs lead to an increase in translation of the 3xPT-miR- 430 and lft2-3′UTR reporter constructs. Note that the GFP in reporters 3xPT-miR-204 and 3xPT-miR-430 migrates more slowly than that in the lft2 3′UTR reporter due to a membrane tethering tag. Actin is a loading control. |
Reprinted from Developmental Cell, 35, van Boxtel, A.L., Chesebro, J.E., Heliot, C., Ramel, M.C., Stone, R.K., Hill, C.S., A Temporal Window for Signal Activation Dictates the Dimensions of a Nodal Signaling Domain, 175-185, Copyright (2015) with permission from Elsevier. Full text @ Dev. Cell


