
- Title
-
An internal promoter underlies the difference in disease severity between N- and C-terminal truncation mutations of Titin
- Authors
- Zou, J., Tran, D., Baalbaki, M., Tang, L.F., Poon, A., Pelonero, A., Titus, E.W., Yuan, C., Shi, C., Patchava, S., Halper, E., Garg, J., Movsesyan, I., Yin, C., Wu, R., Wilsbacher, L.D., Liu, J., Hager, R.L., Coughlin, S., Jinek, M., Pullinger, C.R., Kane, J.P., Hart, D.O., Kwok, P.Y., Deo, R.C.
- Source
- Full text @ Elife

C-terminal ttna truncations result in a severe skeletal muscle phenotype while N-terminal truncations are indistinguishable from wild-type. Fixed heart (A) and skeletal muscle (B) samples of 72 hpf ttnawt/wt, ttnan/n and ttnac/c mutant embryos were analyzed by immunostaining for α–actinin, which highlights Z-disc architecture. The cardiac sarcomere was disarrayed in all mutants. However, in skeletal muscle ttnac/c mutants demonstrated severe sarcomeric disarray while ttnan/n mutants retained sarcomeric architecture. Scale bar: 10 uµm. (C) All targeted TTN exons are constitutive (i.e. not alternatively spliced) in both cardiac and skeletal muscle. PSI values computed for each mutated exon using RNA-Seq data for dissected hearts and trunk skeletal muscle for various mutant genotypes at 72 hpf. Wild-type fish were analyzed at both 72 hpf and adulthood. Analysis was limited to samples with a sufficient number of exon-exon junction reads to accurately estimate PSI (Pervouchine et al., 2013). (D) Nonsense-mediated decay reduces mutant transcript levels to ~20–25% of wild-type, but does not vary substantially across mutations. Targeted RNA-Seq was used to determine the ratio of reads derived from the mutant allele vs. the wild-type allele in ttnan/wtand ttnac/wt heterozygote mutants, which serves as an estimate of nonsense-mediated decay efficiency. |

C-terminal ttna truncations do not act as dominant negatives. (A) Knockdown of ttnb by morpholino injection worsens skeletal muscle sarcomeric architecture in ttnan/n mutants. Fixed skeletal muscle samples of 72 hpf ttnan1/n1 mutant embryos were analyzed by immunostaining for α–actinin. (right) Cartoon representation of ttna and ttnb proteins, with a premature N-terminal stop codon in ttna (gold star). The purple lines indicate morpholino disruption of the ttnb transcript. Scale bar: 10 uµm. (B) Knockdown of ttna by morpholino injection does not rescue skeletal muscle architecture in ttnac1/c1 mutants. ttnac1/c1 embyros were injected with a ttna splice-site morpholino to the exon 4-intron 4 junction at the 1–2 cell stage and embryos were examined at 72 hpf. At this morpholino dose, knockdown efficacy was estimated at close to 80% and nearly complete cessation of cardiac contraction was achieved in >90% of wild-type embryos (data not shown). Immunostaining for α–actinin revealed no improvement in skeletal muscle architecture. (right) Cartoon representation of mutant ttna proteins, with a premature C-terminal stop codon (gold star). The purple lines indicate disruption of the ttna transcript using a morpholino that is expected to introduce an N-terminal truncation upstream of the C-terminal truncation. PHENOTYPE:
|
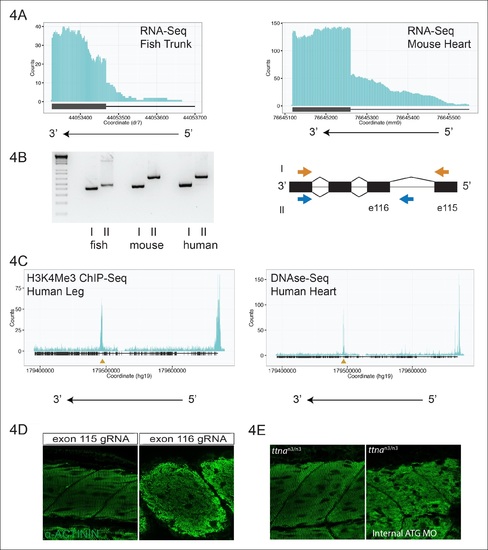
An internal promoter at the distal I-band explains phenotypic differences between N- an C-terminal ttna mutants. (A) RNA-Seq data from 72 hpf zebrafish trunk (left) and E12.5 mouse hearts (right) depicting accumulation of reads within the intron, upstream of the orthologous exons 116 (zebrafish) and 223 (mouse). The Ttn gene is on the negative strand and so reads within the upstream intron are shown to the right of the black bar, which indicates the position of the relevant exon. (B) Transcription from an alternative Titin promoter occurs in zebrafish, mouse, and human heart. (left) PCR amplification using a primer in the upstream exon or an internal primer at or near the internal TSS (as determined by 5′-RACE) as forward primer and a shared reverse primer was performed using cDNA from zebrafish, mouse and human heart. For all three species, products of the expected size were found, supporting transcription from an internal promoter. (right) Cartoon representation of PCR amplification scheme, with exon numbering according to zebrafish transcript. The zebrafish 5′ UTR is shorter than that of mouse and human. (C) (left) H3K4me3 ChIP-Seq data from human fetal leg muscle (GEO Accession GSM1058781), indicating an active promoter overlies exon 240, which is orthologous to exon 116 in zebrafish. The peak at the far right of the figure represents the conventional human TTN promoter. (right) DNAse-Seq data from human fetal heart (GEO Accession GSM665830) indicates highly accessible chromatin overlying exon 240, which typically demarcate enhancers or promoters (Neph et al., 2013). The accessible chromatin peak at the far right is the conventional TTN promoter. The gold triangle in both panels indicates the genomic position of the human internal promoter TSS identified through 5′-RACE. (D) Phenotypic divergence in skeletal myopathy in ttna truncations occurs at the exons flanking the alternative promoter. Cas9 protein and high dose gRNAs corresponding to exon 115 or exon 116 were injected into 1 cell embryos. At 72 hpf, embryos with complete or near complete cessation of cardiac contraction were collected and immunostained for α–actinin to assess skeletal muscle architecture. (E) An ATG morpholino targeting the intronic region upstream of the novel initiator methionine is sufficient to create skeletal muscle disarray on a ttnan3/n3 background. 1–2 cell embryos from a ttnan3/wt cross were injected with an intronic morpholino and ttnan3/n3 homozygotes immunostained for α–actinin to assess sarcomere architecture in the skeletal muscle. No skeletal muscle disarray was seen in wild-type fish injected with the internal ATG morpholino (data not shown). PHENOTYPE:
|

Tissue and developmental profile of Cronos and ttna expression in zebrafish and mouse heart and skeletal muscle. (A) In situ hybridization at 72 hrpf (left) and 24 and 48 hpf (right) reveal prominent expression of both Cronos and full length ttna isoforms in zebrafish somites. In contrast, Cronos expression in developing zebrafish heart (arrow) is at low levels. (B) Quantitative PCR estimates of the ratio of Cronos to full-length ttna reveals prominent expression in developing zebrafish skeletal muscle, but markedly reduced expression in developing heart and in adult heart and skeletal muscle. (C) Quantitative PCR estimates of the ratio of Cronos to full-length Ttn reveals prominent expression in developing mouse hearts, which diminishes through development. Skeletal muscle Cronos expression is comparable in early postnatal mouse, but diminished in adulthood and varies by skeletal muscle bed. EDL = extensor digitorum longus. LV/RV = left/right ventricle. EXPRESSION / LABELING:
|

Unillustrated author statements PHENOTYPE:
|