
- Title
-
In vivo dynamics of skeletal muscle Dystrophin in zebrafish embryos revealed by improved FRAP analysis
- Authors
- Bajanca, F., Gonzalez-Perez, V., Gillespie, S.J., Beley, C., Garcia, L., Theveneau, E., Sear, R.P., Hughes, S.M.
- Source
- Full text @ Elife

Human Dystrophin expression in the zebrafish embryo. (A) Main features of the human Dystrophin expression constructs engineered for this study. (B) Schematic illustrating 2 dpf zebrafish embryo. Slow muscle fibres within the chevron-shaped somite, one magnified and highlighted in blue, are typically aligned anterior-posteriorly with their tips (dark blue) attaching at vertical somite borders. (C) Immunofluorescent detection of exogenous huDys (green, arrows) at fibre tips, co-localizing with endogenous zebrafish Dystrophin (zfDys, red) that accumulates at the tips of every muscle fibre, marking the somite border. (D) In vivo expression of control GFP shows accumulation in muscle fibre cytoplasm without enrichment at the fibre tips. (E) Immunodetection with antibody specifically recognizing human Dystrophin on whole mount 2 dpf embryo shows punctate accumulation of exogenous huDys (arrow) suggestive of localization at the NMJ, in addition to fibre tips (arrowheads). (F) Immunodetection on longitudinal cryostat sections of 2 dpf somitic muscle shows enrichment of endogenous zebrafish Dystrophin (zfDys) at NMJ (arrows). Note concentration of most zfDys at fibre tips (arrowheads). (G) Maximum intensity projection of a confocal stack showing accumulation of huDysGFP in a muscle fibre in vivo. Strong enrichment is noticeable at the tips (arrows), membrane protrusions (yellow arrowheads), and NMJ (red arrowheads). (H) Double immunofluorescent detection of GFP in a huDysGFP-expressing embryo (huDysGFP, green) and α-bungarotoxin (BTX, red) confirms co-localization at the NMJ (insert). (I, J) huDysGFP mRNA detected by in situ hybridization (arrows in I, Nomarski) localises at fibre tips like GFP fluorescence detected while in vivo (arrows in J; confocal maximum projection). Scale bars = 10 µm. |
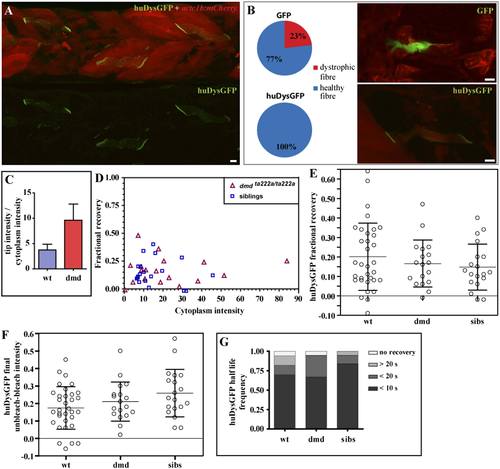
huDysGFP rescuing and binding dynamics in dmdta222a/ta222a embryos. (A) 3 dpf dmdta222a/ta222a zebrafish embryo with typical dystrophic muscles as shown by actc1b:mCherry reporter (red) in vivo, with several healthy fibres expressing huDysGFP (green). (B) Control GFP mosaically expressed in dmdta222a/ta222a embryos is found in both healthy (77%) and dystrophic (23%) fibres (N = 56). Expression of huDysGFP fully rescues the dystrophic phenotype in dmdta222a/ta222a muscle fibres, as no cells expressing huDysGFP were found detached or unhealthy in any visible aspect (N = 56). p = 0.000126 in Chi-square test for significance between GFP and huDysGFP. GFP and huDysGFP-positive cells in regions of very dystrophic muscles in dmdta222a/ta222a zebrafish embryos are shown. The actc1b:mCherry reporter filling up the cytoplasm and huDysGFP expression at the tip suggest that the fibre structure is kept intact even without support from neighbouring cells, unlike the GFP-positive cell. (C) huDysGFP ratio tip intensity/cytoplasm intensity in wild-type (mean = 3.7 ± 1.1 s.e.m.; n = 33) and dmdta222a/ta222a (mean = 9.6 ± 3.2 s.e.m.; n = 13) zebrafish embryos. In the wild-type background, where huDysGFP competes with endogenous Dystrophin for available binding sites, the average ratio is 2.5 times lower than in the mutant background (p = 0.03), where huDysGFP can occupy all available sites. (D) Scatter plot of fractional recovery in bleached tip pixels as a function of the cytoplasmic intensity. (E) Comparative scatter plots, with mean and SD, of huDysGFP fractional recovery in bleached tip pixels in wild-type (wt), dmdta222a/ta222a (dmd) and their siblings (sibs). There were no statistically significant differences between groups as determined by one-way ANOVA [F(2,67) = 0.8628, ns]. (F) Comparative scatter plots, with mean and SD, of huDysGFP final unbleached tip minus bleached tip intensities in wild-type (wt), dmdta222a/ta222a (dmd) and their siblings (sibs). There were no statistically significant differences between groups as determined by one-way ANOVA [F(2,67) = 2.845, ns]. (G) huDysGFP fraction of cases showing no recovery, or 50% recovery at the first (<10 s), second (<20 s), or later (>20 s) time points, calculated from unbleached tip minus bleached tip intensities, in wild-type (wt), dmdta222a/ta222a (dmd) and their siblings (sibs). There were no statistically significant differences between groups as determined by one-way ANOVA [F(2,67) = 0.1521, ns]. Scale bars = 10 µm. |

ZFIN is incorporating published figure images and captions as part of an ongoing project. Figures from some publications have not yet been curated, or are not available for display because of copyright restrictions. EXPRESSION / LABELING:
|