
- Title
-
A Kupffer's vesicle size threshold for robust left-right patterning of the zebrafish embryo
- Authors
- Gokey, J.J., Ji, Y., Tay, H.G., Litts, B., Amack, J.D.
- Source
- Full text @ Dev. Dyn.

Analysis of variation in development of Kupffer′s vesicle in wild-type embryos. A–C: Representative maximum projections of confocal images of KV cells labeled with aPKC antibodies (magenta) to mark the KV lumen and acetylated Tubulin antibodies (green) to visualize cilia at 8 ss. These examples show a TAB wild-type embryo with small KV size and few cilia (A) and embryos with an intermediate (B) or larger (C) lumen size. D–F: Quantification of KV cilia number (D), cilia length (E), and lumen area (F) at 4 ss (n = 26 embryos), 6 ss (n = 23), 8 ss (n = 30), and 10 ss (n = 30). The horizontal line in the box and whisker plots indicates the mean and the whiskers show the minimum and maximum values. G: Variations in cilia number, cilia length, and lumen size at each developmental stage are represented as one standard deviation converted to a percentage of the mean. |
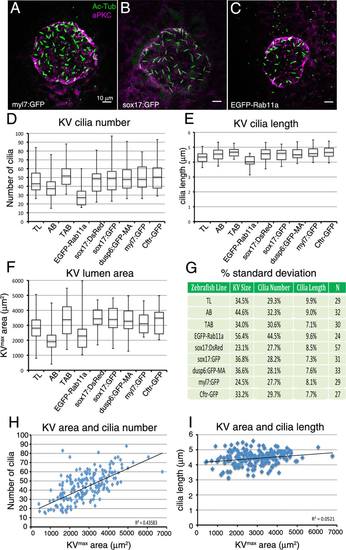
The amount of variation in Kupffer′s vesicle development is similar among different wild-type and transgenic strains. A–C: Images of KV at 8 ss from three different transgenic strains. KVs appeared similar in most strains, including Tg(myl7:GFP) (A) and Tg(sox17:GFP) (B), but were smaller inTg(h2afx:EGFP-rab11a) (C). See text for descriptions of each strain. D–F: Analysis of KV cilia number (D), cilia length (E), and lumen area (F) at 8 ss for different wild-type (TL and AB) and several transgenic strains. Data from wild-type TAB strain at 8 ss presented in Figure 1 are included for comparison. The number of embryos (N) analyzed for each strain is indicated in (G). G: Variations in cilia number, cilia length, and lumen size are represented as one standard deviation as a percentage of the mean. H,I: Analysis of potential correlations between KV lumen area and cilia number (H) and KV lumen area and cilia length (I). Each point represents a single embryo (n = 292 embryos). The R2 (coefficient of determination) value is listed for all strains pooled. |
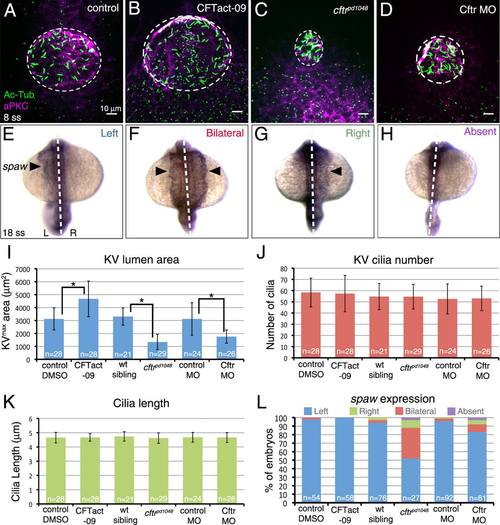
Role of Kupffer′s vesicle size in LR patterning. A–D: Modulating Cftr activity was used to alter KV lumen size at 8 ss. The Cftr activating drug CFTact-09 increased KV size (B), whereas a loss-of-function mutation (C) or morpholino (MO) interference (D) reduced KV size relative to controls (A). Dashed circles represent approximate KV lumen boundaries. E–H: Possible outcomes of RNA in situ hybridization analysis of the LR patterning marker spaw in lateral plate mesoderm (arrowhead) at 18 ss are normal left-sided (E), bilateral (F), reversed right-sided (G), or absent (H) expression. Dashed lines indicate the embryonic midline. L = left; R = right. I–K: Quantification of KV area (I), cilia number (J), and cilia length (K) in embryos with altered Cftr function and controls. L: Analysis of spaw expression in Cftr modulated embryos. Error bars represent one standard deviation. N = number of embryos analyzed. * indicates P < 0.05. |
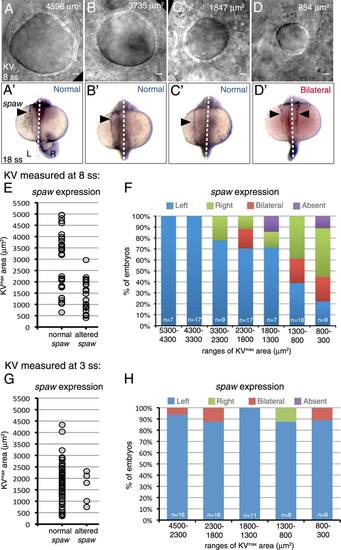
Identification of a Kupffer′s vesicle size threshold necessary for robust LR patterning. A–D: Representative DIC images of different sized KVs in living wild-type embryos at 8 ss. The KVmax area is indicated for each representative embryo. (A′-D′) spaw expression (arrowhead) at 18 ss in the same embryos. Dashed lines indicate the embryonic midline. L = left; R = right. E–H: Analysis of spaw asymmetry in embryos in which KV was measured at 8ss (E,F) or 3 ss (G,H). E,G: Normal (left-sided) and altered (bilateral, reversed or absent) spaw outcomes were plotted based on KVmax area. Each point represents a single embryo. F,H: Observed spaw expression in embryos within specific ranges of KVmax areas. N = number of embryos analyzed. |