
- Title
-
Opposing Shh and Fgf signals initiate nasotemporal patterning of the retina
- Authors
- Hernández-Bejarano, M., Gestri, G., Spawls, L., Nieto-López, F., Picker, A., Tada, M., Brand, M., Bovolenta, P., Wilson, S.W., Cavodeassi, F.
- Source
- Full text @ Development

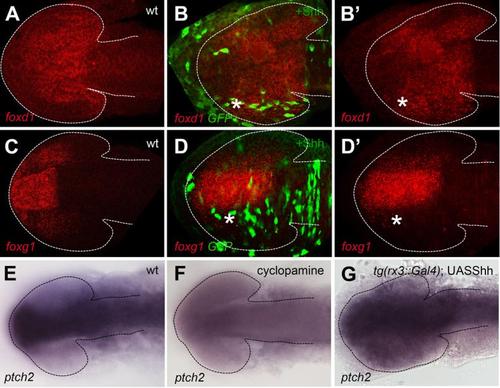
Lack of Hh signalling results in loss of temporal fate. (A) Schematic of early (left) and late (right) organisation of nasotemporal (NT) domains in the developing eye. Note that the NT axis, initially aligned with the DV axis of the embryo, rotates and becomes aligned with the AP axis as development proceeds. Red, temporal domain; green, nasal domain; blue, Shh source. (B-M) Dorsal with anterior to the left (B,D,F-H,J) and frontal (C,E,I,K-M) views of forebrain and eyes showing expression of foxd1 (B,C,F,H,I,L) and foxg1 (D,E,G,J,K,M) in the genotypes and treated conditions specified in the panels. All embryos were 10-12ss other than those shown in L and M, which were 5ss. (N,O) Schematic representations of the phenotypic outcome of foxg1/foxd1 expression in wild-type (N) and lack of Shh (O) conditions. Scale bars: 100µm. Numbers in the bottom-right of each panel indicate the number of embryos with the phenotype shown out of the total number of embryos analysed. n, nasal; t, temporal; t*, defective temporal domain. Dashed lines outline the forebrain (dorsal views) or the optic vesicles (frontal views). |
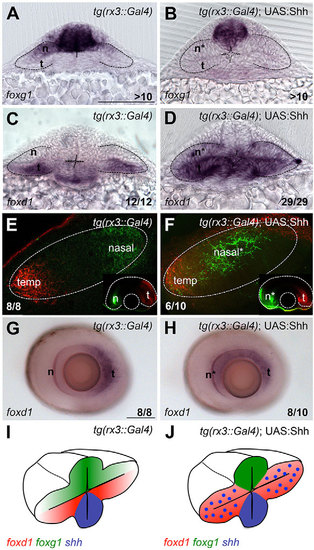
Ectopic Hh activity in the optic vesicle promotes temporal fate. (A-D,G,H) Expression of foxg1 (A,B) and foxd1 (C,D,G,H) in the genotypes specified in the panels. (E,F) Retinotectal projections traced with DiI/DiO to label nasal (n; green) and temporal (t; red) projections. Main panels show the tectum with anterior to the left; insets show the corresponding eye. (I,J) Schematic of the phenotypic outcome of foxg1/foxd1 expression in the conditions shown in the figure. A-D are frontal views; G and H are lateral views of dissected eyes. All embryos are at 10-12ss except those in E-H, which are 6dpf. Scale bars: 100µm. Numbers in the bottom-right of each panel indicate the number of embryos with the phenotype shown out of the total number of embryos analysed. n*, defective nasal domain. Dashed lines outline the optic vesicles (A-D), the tectum (E,F) and the optic cup (insets in E,F). |

Lack of Fgf activity alters NT patterning independently of Shh activity. (A-L) Expression of foxg1 (A,B), foxd1 (C,D), shh (E,F), Kaede (G,H), fgf8 (I,J) and sprouty4 (K,L) in the conditions specified in the panels. A-H are frontal views; I-L are dorsal views with anterior to the left. All embryos are at 10-12ss. Scale bars: 100µm. Numbers in the bottom-right of each panel indicate the number of embryos with the phenotype shown out of the total number of embryos analysed. n, nasal; t, temporal; n*, defective nasal domain. Dashed lines outline the forebrain (dorsal views) or the optic vesicles (frontal views). |
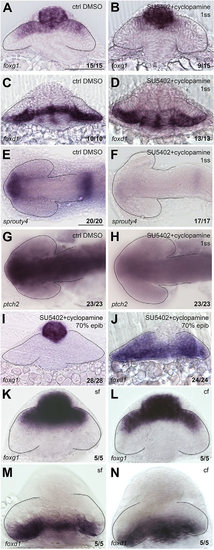
NT patterning is restored upon combined abrogation of both Fgf and Hh signals. Expression of foxg1 (A,B,I,K,L), foxd1 (C,D,J,M,N), sprouty4 (E,F) and ptch2 (G,H) in in the conditions specified in the panels. A-D,I-N are frontal views; E-H are dorsal views with anterior to the left. All are zebrafish embryos at 10-12ss, except for those in K-N, which are cavefish (cf) and surface fish (sf) forms of Astyanax mexicanus. Scale bars: 100µm. Numbers in the bottom-right of each panel indicate the number of embryos with the phenotype shown out of the total number of embryos analysed. Dashed lines outline the forebrain (dorsal views) or the optic vesicles (frontal views). |

Mutual repression between foxg1 and foxd1 maintains the NT border. (A-D) foxd1 (A,B) and foxg1 (C,D) expression in the conditions detailed in the panels. All panels show dorsal views with anterior to the left at 10-12ss. (E) Schematic representation of the regulatory interactions inferred from our manipulations. (F) Representative Tg (rx3:Gal4); UAS:foxd1 embryo showing widespread GFP expression in the optic vesicles. All embryos selected for in situ analysis showed similarly broad GFP expression. Scale bar: 100µm. Numbers in the bottom-right of each panel indicate the number of embryos with the phenotype shown out of the total number of embryos analysed. Dashed lines outline the forebrain. |
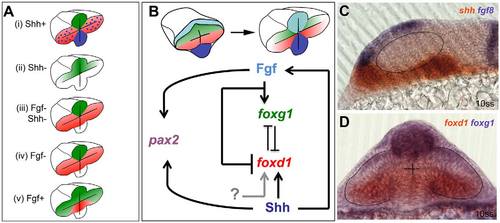
Opposing roles for Fgfs and Shh in the control of optic vesicle patterning. (A) Schematics of foxg1 (green) and foxd1 (red) expression in optic vesicles following manipulations of Fgf and Hh signals. The implications below are based on the ability of Foxg1 to repress foxd1 expression and Foxd1 to repress foxg1 expression. (i) Shh gain of function: loss of foxg1 and gain of foxd1 in nasal retina. This implies that Shh signalling promotes foxd1 expression and/or inhibits foxg1 expression. Blue shading and dots represent Shh expression. (ii) Shh loss of function: loss of foxd1 in temporal retina. This implies that Shh promotes foxd1 expression but is not required for repression of foxg1. (iii) Combined loss of Shh and Fgf: loss of foxg1 and gain of foxd1 in nasal retina. This implies that either unknown signals (grey arrow in B) promote foxd1 expression in absence of Shh or that repressors (such as Fgf itself) are removed in this situation. The result also implies that Fgf is required for the repression of foxd1 in temporal retina (shown in ii), and that this repression is independent of Foxg1 (which is not expressed in temporal retina). (iv) Loss of Fgf expression: loss of foxg1 and gain of foxd1 in nasal retina. This implies that Fgf promotes foxg1 and/or inhibits foxd1 in nasal retina. (v) Gain of Fgf function: gain of foxg1 expression and loss of foxd1 expression in temporal retina (data taken from Picker et al., 2009). This implies that Fgf promotes foxg1 expression and/or inhibits foxd1 expression. (B) Proposed regulatory interactions that could explain the retinal nasotemporal phenotypes shown in A, together with data not shown that both Fgf and Shh promote development of pax2+ optic stalk identity in the proximal optic vesicle. As stated in the main text, the regulatory interactions leading to nasotemporal patterning occur from neural plate stage onwards. (C,D) Images showing the domains of expression in the forebrain of genes encoding the signals studied (C) and their Fox gene targets (D), as evident from double in situ hybridisation assays of 10ss embryos. Dashed lines outline the optic vesicles. |

Hh is required for temporal specification only before 6ss. foxg1 (A,C) and foxd1 (B,D) expression is normal in embryos treated with cyclopamine from 6ss. (E-L) Images showing effects of cyclopamine and SU5402 upon transgenes expressed in nasal (Tg{CldnB::GFP}) and temporal (Tg{HGn42a::GFP}) domains. (A-D) are dorsal views with anterior to the left; (E-L) are lateral views of the eye with anterior to the left. |

Primary forebrain subdivision is unaffected upon manipulation of Hh and Fgf signals in the eye field. (A-B) dorsal views with anterior to the left showing mab21/2 expression in Tg{rx3::Gal4} (A) and Tg{rx3::Gal4};UAS:Shh (B) eyes and brains. (C-H) Frontal (C,E,G) and dorsal (D,F,H) views of brains and eyes following drug treatments in Tg{rx3::GFP} and Tg{emx3::YFP}. In all conditions there are no changes in primary forebrain subdivisions. All embryos are 12ss. |
Mosaic overexpression of Hh activity in the optic vesicle promotes temporal fate. (A-D′) Mosaic overexpression of Shh reproduces the phenotypes observed by using the Gal4/UAS system (compare to main figure 2). (E-G) Images of brains and eyes showing expression of the Shh target ptch2 is lost in a cyclopamine treated embryo (H) and overexpressed in a tg(rx3::Gal4);UAS:shh embryo, consistent with the expected alterations to Hh pathway activity under these conditions. |
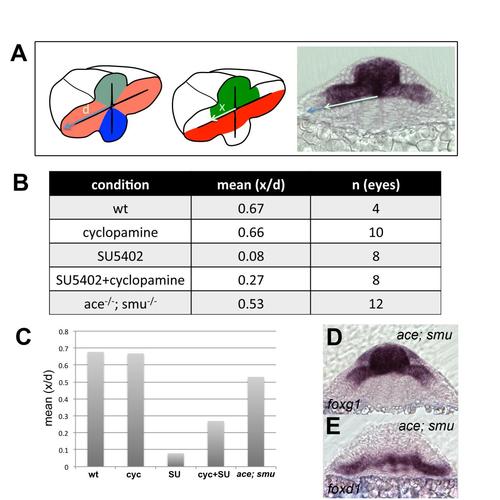
Quantification of extension of foxg1 expression in all the experimental conditions presented in the study. (A) Rationale of the quantification strategy. Dividing x by d normalises the extension of foxg1 expression to the total length of the optic vesicle. (B) Table showing the mean of x/d for the number of eyes (n) quantified. (C) Graph representing the results from (B). |