
- Title
-
The Role of ARF6 in Biliary Atresia
- Authors
- Ningappa, M., So, J., Glessner, J., Ashokkumar, C., Ranganathan, S., Min, J., Higgs, B.W., Sun, Q., Haberman, K., Schmitt, L., Vilarinho, S., Mistry, P.K., Vockley, G., Dhawan, A., Gittes, G.K., Hakonarson, H., Jaffe, R., Subramaniam, S., Shin, D., Sindhi, R.
- Source
- Full text @ PLoS One
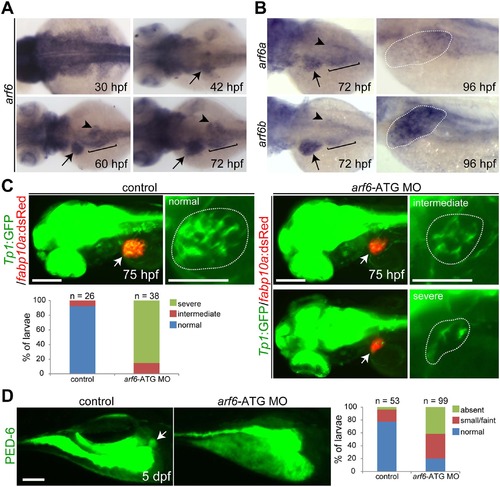
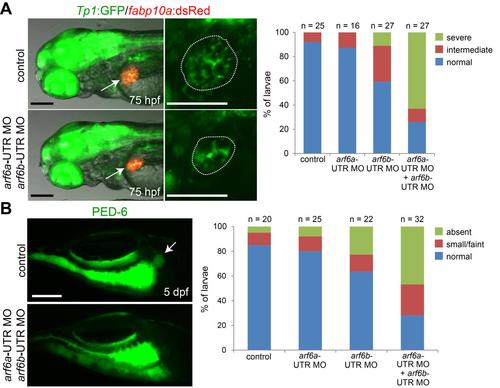
arf6 knockdown results in developmental biliary defects in zebrafish. (A, B) Whole-mount in situ hybridization showing arf6a and arf6b expression in developing embryos/larvae. Arrows point to the liver; arrowheads the pancreas; brackets mark the intestinal bulb. (C) The Tg(Tp1:GFP) and Tg(fabp10a:dsRed) lines reveal the intrahepatic biliary structure and liver size, respectively. Epifluorescence images showing the expression of these transgenes revealed a defect in the intrahepatic biliary structure in arf6-ATG MO-injected larvae. Based on the severity of the biliary defect, larvae were divided into three groups: normal, intermediate, and severe. Graph shows the percentage of larvae in each group. Arrows point to the liver; dotted lines outline the liver (A-C). (D) Epifluorescence images showing PED-6 accumulation in the gallbladder (arrows). Based on PED-6 levels in the gallbladder, larvae were divided into three groups: absent, small/faint, and normal. Graph shows the percentage of larvae in each group. n, the number of larvae examined; scale bars, 100 µm. EXPRESSION / LABELING:
PHENOTYPE:
|
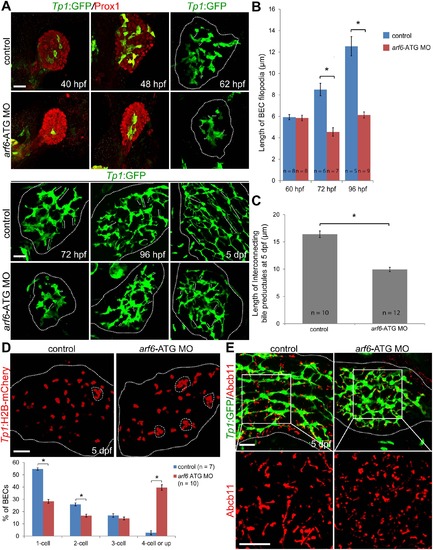
arf6 regulates intrahepatic biliary morphogenesis. (A-C) Confocal images showing the development of the intrahepatic biliary network. Tg(Tp1:GFP) embryos/larvae were processed for immunostaining with anti-GFP (green). For 40 and 48 hpf, anti-Prox1 staining (red) was also used. Brackets delineate the length of BEC filopodia at 62, 72, and 96 hpf, and the length of interconnecting bile preductules at 5 dpf (A); graphs show their quantitation (B, C). (D) Confocal images showing the location of BEC nuclei in the entire liver. The Tg(Tp1:H2B-mCherry) line reveals BEC nuclei. Dashed lines outline clusters with four or more BECs. Graph shows the percentage of BECs present as single cells, doublets, triplets, or in clusters of four or more cells. (E) Confocal images of the liver immunostained for GFP (green) and Abcb11 (red). The Tg(Tp1:GFP) line and anti-Abcb11 reveal the intrahepatic biliary structure and bile canaliculi, respectively. All dotted lines outline the liver. Asterisks, statistical significance (* p<0.0001); error bars, ± SEM; scale bars, 25 µm. |
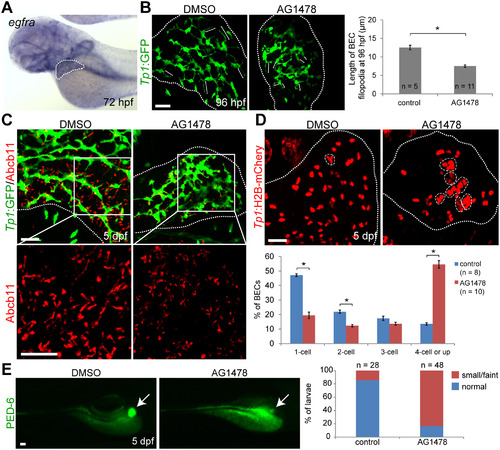
EGFR signaling regulates biliary morphogenesis. (A) Whole-mount in situ hybridization image showing egfra expression in the liver at 72 hpf. (B) Confocal images of the liver showing the intrahepatic biliary structure, as revealed by Tp1:GFP expression. Tg(Tp1:GFP) embryos were treated with DMSO or 4 µM AG1478 from 48 to 96 hpf, and processed for whole-mount immunostaining with anti-GFP antibody. The length of BEC filopodia was quantified as shown in a graph. Brackets delineate the length of BEC filopodia. (C) Confocal images of the liver showing the expression of Tp1:GFP (green) and Abcb11 (red) for biliary structure and bile canaliculi, respectively. (D) Confocal images of the liver showing the location of BEC nuclei in the entire liver, as assessed by Tp1:H2B-mCherry expression. Dashed lines outline clusters with four or more BECs. Graph showing the percentage of BECs present as single cells, doublets, triplets, or in clusters of four or more cells. (E) Epifluorescence images showing PED-6 accumulation in the gallbladder in DMSO- or AG1478-treated larvae at 5 dpf. Graph showing the percentage of larvae exhibiting different levels of PED-6 accumulation in the gallbladder. Arrows point to the gallbladder. All dotted lines outline the liver. n indicates the number of larvae examined; asterisks indicate statistical significance (* p<0.0001). Error bars, ± SEM; scale bars, 25 µm. EXPRESSION / LABELING:
|
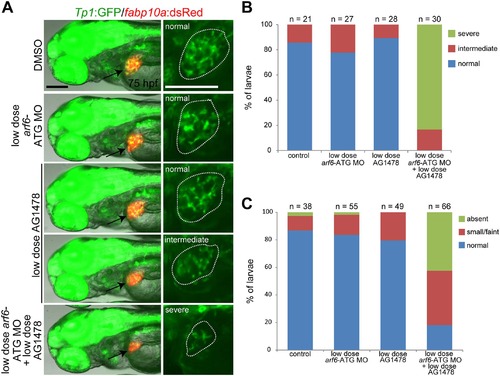
EGFR signaling and Arf6 act in the same pathway in the regulation of intrahepatic biliary morphogenesis. Instead of 4 µM AG1478 and 2 ng of arf6-ATG MO, 1 µM AG1478 and 0.5 ng of arf6-ATG MO were used. (A) Epifluorescence images showing the expression of Tp1:GFP and fabp10a:dsRed revealed a severe defect in the intrahepatic biliary structure only when the MO injection was combined with the AG1478 treatment. Based on the severity of the biliary defect, larvae were divided into three groups: normal, intermediate, and severe. Arrows point to the liver and dotted lines outline the liver. Scale bars, 100 µm. (B) Graph showing the percentage of larvae in each group shown in A. (C) Graph showing the percentage of larvae exhibiting different levels of PED-6 accumulation in the gallbladder at 5 dpf. n indicates the number of larvae examined. PHENOTYPE:
|
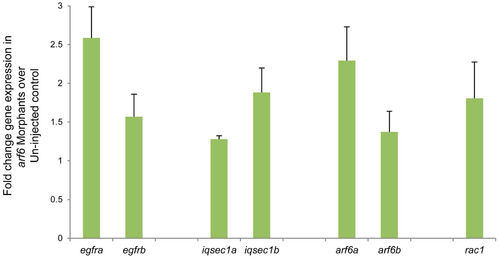
Quantitative RT-PCR analysis of EGFR pathway genes in liver tissue from zebrafish. The relative expression level of genes was shown in fold change in arf6 morphants over un-injected controls. Error bars shown, ± SEM (average of three independent experiments). EXPRESSION / LABELING:
|
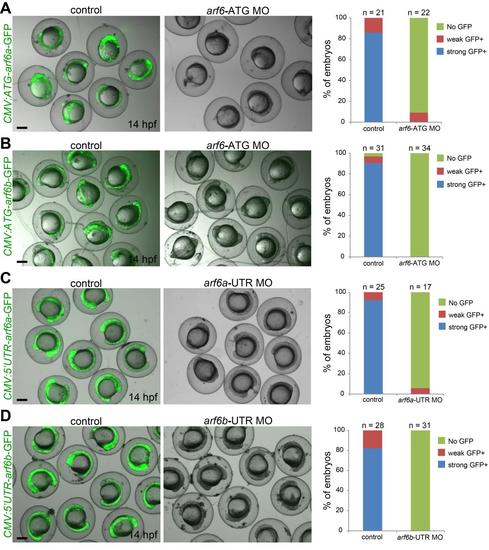
Morpholino validation. (A-D) CMV:GFP constructs containing the target sequence of each MO in front of the GFP start codon were injected alone or together with the corresponding MO. GFP expression was barely detected in the co-injected embryos. Graphs show the percentage of embryos exhibiting strong, weak, or no GFP expression. arf6-ATG MO also blocked GFP expression from the CMV:GFP constructs containing the arf6b region corresponding to the MO target region in arf6a (B), indicating that arf6-ATG MO blocks both arf6a and arf6b translation. n indicates the number of embryos examined. Scale bars: 200 µm. |
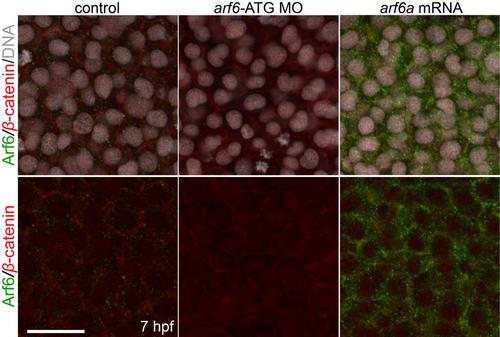
Arf6 expression is greatly reduced in arf6-ATG MO-injected embryos. Wild-type embryos were injected at the one-cell stage with 2 ng of arf6-ATG MO or 120 pg of arf6a mRNA, harvested at 7 hpf, and processed for whole-mount immunostaining with anti-Arf6 (green) and anti-β-catenin (red) antibodies. DNA was also stained with Hoechst 33342 (gray). β-catenin expression reveals the cell membrane. Confocal images showed that Arf6 expression was greatly increased in arf6a mRNA-injected embryos, whereas it was greatly reduced in arf6-ATG MO-injected embryos, validating the efficacy of the MO. Dorsal views; scale bar, 25 µm. |
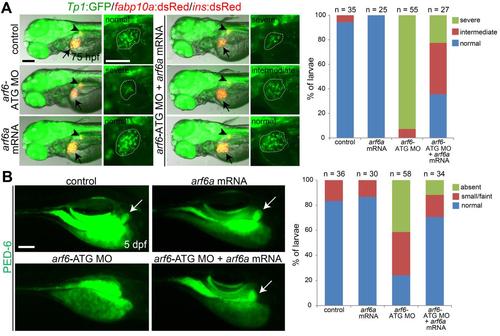
arf6a mRNA injection partially rescues biliary defects in arf6-ATG MO-injected larvae. (A) The Tg(Tp1:GFP), Tg(fabp10a:dsRed), and Tg(ins:dsRed) lines were used to reveal the intrahepatic biliary structure, the liver, and the dorsal pancreas, respectively. Epifluorescence images showing the expression of these transgenes revealed that a defect in the intrahepatic biliary structure in arf6-ATG MO-injected larvae was partially rescued by arf6a mRNA injection. Based on the severity of the biliary defect, larvae were divided into three groups: normal, intermediate, and severe. Graph showing the percentage of larvae in each group. Arrows point to the liver; arrowheads point to the dorsal pancreas. Dotted lines outline the liver. Lateral views, anterior to the left. (B) Epifluorescence images showing PED-6 accumulation in the gallbladder revealed that the PED-6 accumulation defect in arf6-ATG MO-injected larvae was also partially rescued by arf6a mRNA injection. Based on PED-6 levels in the gallbladder, larvae were divided into three groups: absent, small/faint, and normal. Graph showing the percentage of larvae in each group. Arrows point to the gallbladder. Lateral views, anterior to the right. n indicates the number of larvae examined. Scale bars, 100 µm. |
Simultaneous knockdown of arf6a and arf6b results in more severe biliary defects than their single knockdown. (A) The Tg(Tp1:GFP), Tg(fabp10a:dsRed), and Tg(ins:dsRed) lines were used to reveal the intrahepatic biliary structure, the liver, and the dorsal pancreas, respectively. Epifluorescence images showing the expression of these transgenes revealed that a severe biliary defect was observed more often in larvae co-injected with 3 ng of arf6a-UTR and 3 ng of arf6b-UTR MOs than in singly injected larvae. Based on the severity of the biliary defect, larvae were divided into three groups: normal, intermediate, and severe. Graph showing the percentage of larvae in each group. Arrows point to the liver; arrowheads point to the dorsal pancreas. Dotted lines outline the liver. Lateral views, anterior to the left. (B) Epifluorescence images showing PED-6 accumulation in the gallbladder. Based on PED-6 levels in the gallbladder, larvae were divided into three groups: absent, small/faint, and normal. Graph showing the percentage of larvae in each group. Arrows point to the gallbladder. Lateral views, anterior to the right. n indicates the number of larvae examined. Scale bars, 100 µm. EXPRESSION / LABELING:
PHENOTYPE:
|
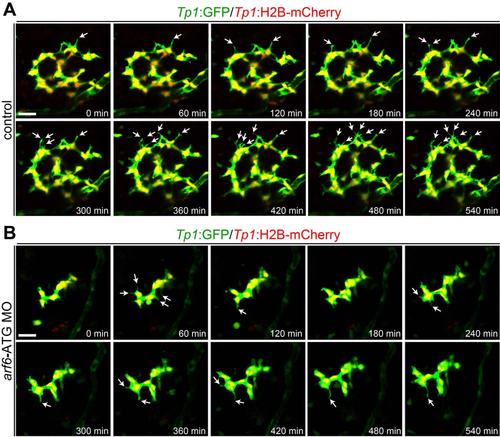
The movement of BEC filopodia is greatly reduced in arf6-ATG MO-injected larvae. (A, B). Time-lapse confocal images showing BEC behaviors in arf6-ATG MO-injected and control larvae. The behaviors were assessed by Tp1:GFP (green) and Tp1:H2B-mCherry (red) expression in BEC cytoplasm and nuclei, respectively. Confocal images every 60 minutes from 74 to 84 hpf were presented. Arrows point to BEC filopodia. Scale bars, 25 µm. PHENOTYPE:
|
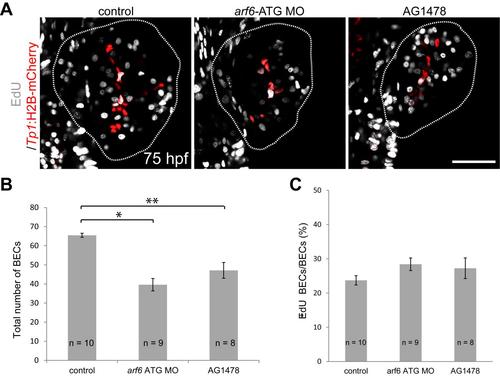
Proliferation is not affected in arf6-ATG MO-injected or AG1478-treated larvae at 75 hpf. (A) Confocal images showing EdU+ proliferating cells (gray) and H2B-mCherry+ BECs (red) in the liver of control, arf6-ATG MO-injected, or AG1478-treated Tg(Tp1:H2B-mCherry) larvae. For EdU labeling, the larvae were treated with EdU for one hour prior to harvest. Dotted lines outline the liver. Scale bar, 50 µm. (B) Graph showing the total number of BECs in each liver. Asterisks indicate statistical significance: * p<0.0001, ** p<0.005. (C) Graph showing the percentage of EdU+ BECs among BECs. Error bars, ± SEM. n indicates the number of larvae examined. PHENOTYPE:
|
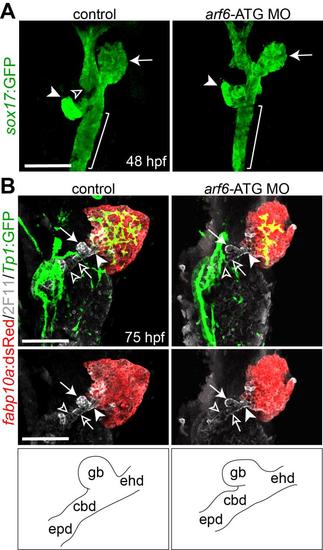
The effect of arf6 knockdown on the development of endoderm-derived organs. (A) Confocal images showing the endoderm and endoderm-derived organs at 48 hpf. The Tg(sox17:GFP) line was used to reveal the endoderm and endoderm-derived organs. Arrows, arrowheads, and open arrowhead point to the liver, the pancreas and the swim bladder, respectively; brackets mark the intestinal bulb. (B) Confocal images showing the hepatopancreatic ductal system at 75 hpf. Tg(Tp1:GFP);Tg(fabp10a:dsRed) larvae were processed for whole-mount immunostaining with 2F11 (gray), GFP (green), and dsRed (red) antibodies. In contrast to the intrahepatic biliary defect, the hepatopancreatic ductal system, revealed by 2F11 antibody, appeared to be normal in arf6-ATG MO-injected larvae. Arrows, arrowheads, open arrowheads, and open arrows point to the gallbladder (gb), the extrahepatic duct (ehd), the common bile duct (cbd), and the extrapancreatic duct (epd), respectively. The hepatopancreatic ductal system is schematically illustrated. Ventral views, anterior up. Scale bars, 50 µm. EXPRESSION / LABELING:
PHENOTYPE:
|