
- Title
-
Retinoic acid signaling spatially restricts osteoblasts and controls ray-interray organization during zebrafish fin regeneration
- Authors
- Blum, N., Begemann, G.
- Source
- Full text @ Development

shha expression is controlled by cyp26a1-expressing epidermal niches. Lateral expansion of the cyp26a1-expressing niches and misguidance of preosteoblasts precede fusion of sister rays. (A) Overview of a regenerating fin. (B) Schematized representation of the amputation levels. (C-E,L) Amputations in proximity to bifurcations cause fusion of cyp26a1 expression domains (arrowhead in L), followed by spreading of preosteoblasts into the interray separating the two sister rays (arrowhead in E) and fusion of sister rays (arrow in C). (C) Alizarin Red staining at 9 dpa. Arrowheads indicate branching sites. (D) Distance range between sister rays for separated and fused rays. (E) IHC for ZNS-5 and GFP in osc:gfp fish at 2.5 dpa. (F,G) WISH and ISH on sections for cyp26a1 reveals expression in the proximal basal epidermal layer (arrowhead) adjacent to preosteoblasts (asterisks) at 2 and 3 dpa. (G) aldh1a2 is expressed in fibroblast-derived blastema cells, but not in preosteoblasts adjacent to cyp26a1-expressing cells. (H,I) RA and R115866 injection downregulates shha and ptch2. Transcript levels 6 or 8 hours after injection at 4 dpa measured by qPCR (H); WISH for shha 12 hours after R115866 injection at 4 dpa (I). (J,K) Overexpression of cyp26a1 in hsp70I:cyp26a1 fish at 4 dpa causes upregulation of shha expression and lateral expansion of the expression domains. Arrows mark the lateral expression limits. Of note, shha in wild-type controls is already expressed in subdomains due to the upcoming bifurcation event. (L) WISH for cyp26a1 at 1.5 dpa. Double-headed arrows in E and L: distance between sister rays. Asterisk marks the gap between the two subdomains. Data are represented as mean±s.e.m. *P<0.05, **P<0.01, ***P<0.001. Dashed lines indicate amputation plane. Scale bars: 100µm. h, hours; hs, heat shock. |

Preosteoblast alignment and maintenance of the ray-interray organization requires RA-degrading epidermal niches. (A) IHC for GFP in osc:gfp fish reveals ectopic GFP+ preosteoblasts in interrays in RA-treated fish at 2.5dpa. Arrowhead indicates preosteoblast in interray tissue, arrow indicates proximally migrating preosteoblast in interray tissue. (B,C) WISH for msxb (B) and EdU labeling (C) at 2.5dpa demonstrate expansion of blastema cells into interrays in RA-treated fish. Arrowheads indicate ectopic blastema cells. (D) fli:gfp fish show misconnected blood vessels (arrowhead) in RA-treated fish at 2.5dpa. (E,F) RA and R115866 treatment during blastema formation result in formation of ectopic bone at the wound site and in R115866-treated fish in an irreversible regeneration block. Arrowheads indicate ectopic bone, dashed lines indicate amputation plane. Scale bars: 100µm. |

Shha-promoted osteoblast proliferation requires cyp26a1 expression that is restricted to proximal regions by Fgf activity. (A,B) Cyclopamine (A) or prolonged RA (B) treatment downregulates osteoblast proliferation. EdU+/ZNS-5+ cells per section at 3.5dpa. (C) Inhibition of osteoblast proliferation 12h after RA injection can be rescued by concomitant SAG treatment. EdU+/ZNS-5+ cells per section at 3.5dpa. (D) Inhibition of Fgf signaling in hsp70I:dn-fgfr1 fish results in upregulation of cyp26a1 expression. Conversely, activation of Fgf signaling in hsp70I:v-ras fish results in the downregulation of cyp26a1. Transcript levels at 3dpa measured by qPCR. (E-H) ZNS-5- and cyp26a1-free distal domains (double-headed arrows) extend further proximally in regenerates that had been amputated at a more proximal level at 3dpa (F-H), and retracts distally as regeneration proceeds (E). (G) WISH for cyp26a1. (H) IHC for ZNS-5. (E,F) Length of the cyp26a1- or ZNS-5-free distal domain. Data are represented as mean±s.e.m. *P<0.05, **P<0.01, ***P<0.001. ns, not significant; hs, heat shock. Scale bars: 100µm. |
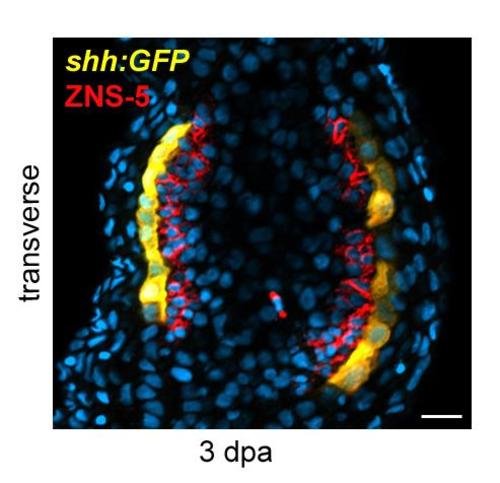
shha is expressed within the basal epidermal layer adjacent to aligned osteoblasts. IHC for ZNS-5 and GFP in shh:gfp fish at 3 dpa reveals shha expression in the basal epidermal layer adjacent to osteoblasts (ZNS-5+). Scale bar: 50 µm. |

R115866 treatment does not interfere with basal epidermal layer formation, but cause lateral expansion of msxb+ cells into neighbouring interrays. (A) DAPI-stained transverse sections through the regenerate of DMSO- and R115866- treated fish reveal presence of a distinct basal epidermal layer. Arrowheads: Basal epidermal layer. (B) WISH for msxb at 2.5 dpa demonstrates expansion of blastema cells into interrays in R115866-treated fish. Arrowheads: Ectopic blastema cells. Dashed lines indicate amputation plane. Scale bars: 50 µm in A and 100 µm in B. |
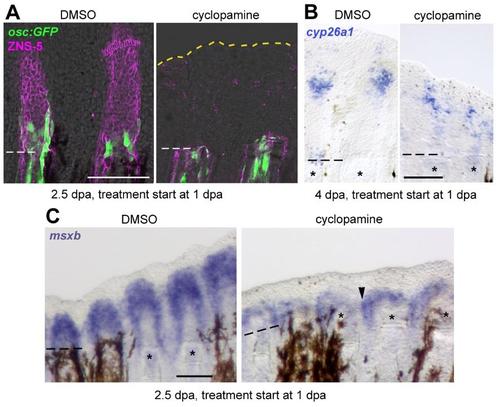
Absence of preosteoblasts causes blastema expansion. Cyclopamine treatment starting at 1 dpa results in preosteoblast-free blastema and lateral expansion of blastema cells, but normal cyp26a1 expression. (A) IHC for ZNS-5 and GFP in osc:gfp fish demonstrates lack of GFP+ preosteoblasts in the blastema of cyclopamine treated fish at 2.5 dpa. Yellow dashed line indicates the distal blastema edge in cyclopamine treated fish. (B) WISH for cyp26a1 at 4 dpa reveals unaltered cyp26a1 expression in cyclopamine treated fish (C) WISH for msxb demonstrates lateral expansion of blastema cells into the interray tissue (arrowhead) in cyclopamine treated fish. Dashed lines indicate amputation plane. Scale bars: 100 µm. |
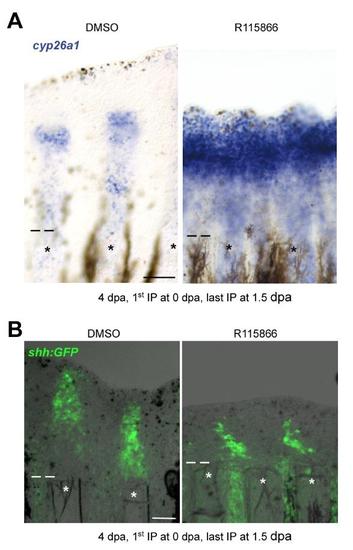
shha expression is ectopically expressed in interrays upon recovery from R115866 treatment. (A) WISH for cyp26a1 2 days after termination of R115866 treatment at 4 dpa reveals cyp26a1 expression in the entire epidermis of ray and interray tissue. (B) IHC for GFP in shh:gfp fish 2 days after termination of R115866 treatment at 4 dpa reveals ectopic shha expression in interrays. Asterisks indicate rays. Dashed lines indicate amputation plane. Scale bars: 100 µm. |

Ectopic bone does not seal the wound in regenerates of R115966 treated fish. Distal view of an Alizarin Red stained regenerate of R115866-treated fish reveals that ectopic bone is restricted to lateral regions and does not seal the blastema. Arrowheads: Ectopic bone in the interray region. Dashed line indicate amputation plane. Scale bars: 100 µm. |
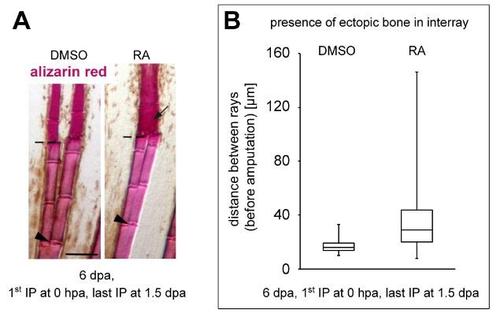
RA treatment induces ectopic bone in interrays and fusion of sister rays. (A) RA injections upon amputation within 3-4 segments distal to the first branching point (long cut) result in fusion of sister rays. Alizarin Red staining. Arrowheads: Branching site. Dashed lines indicate amputation plane. Scale bar: 100 µm. (B) The distance range between rays where formation of ectopic bone occurs is much greater in RA-treated fish. Box plot of distances between rays. |