- Title
-
Loss of DDB1 Leads to Transcriptional p53 Pathway Activation in Proliferating Cells, Cell Cycle Deregulation, and Apoptosis in Zebrafish Embryos
- Authors
- Hu, Z., Holzschuh, J., Driever, W.
- Source
- Full text @ PLoS One
|
Phenotype of m863 mutant embryos. (A-F) Reduction of th-expressing dopaminergic neurons in the pretectum and retina of m863 mutants at 72hpf. (A-C) Lateral (A) and dorsal (B-C) views of th expression pattern in wild type siblings. (D-F) Lateral (D) and dorsal (E-F) views of th expression pattern in homozygous mutant m863 larvae. Arrows indicate affected DA groups in the pretectum (D, F) and retina (E′). (G-J) Morphological phenotype of live m863 mutants at 4 dpf. Dorsal (G) and lateral (H) views of wild type larvae. Dorsal (I) and lateral (J) views of homozygous m863 mutants. Compared to wild type siblings, m863 mutants displayed smaller eyes (blue arrow), flattened and smaller head, edema (red triangle), and defective swim bladder (red arrow), but normal body length. (K, N) Lateral views of live wild type (K) and homozygous m863 mutants (N) at 48 hpf. Granular tissue appearance in the midbrain region and retina of mutants indicated elevated cell death. (L,M,O,P) Ventral views of Alcian blue staining of head cartilage in wild type (L, M) and homozygous m863 mutants (O, P) at 4 dpf. The cartilaginous head skeleton of mutants was smaller and underdeveloped compared to wild type siblings. Abbreviations used: Catecholaminergic groups: AAN, arch-associated neurons (noradrenergic); H, hypothalamus; LC, locus coeruleus; MO, medulla oblongata (noradrenergic); OB, olfactory bulb; PO, preoptic region; Pr, pretectum; PT, posterior tuberculum; SP, subpallium; sym, sympathetic neurons (catecholaminergic); VT, ventral thalamus. Cartilage structures: bb, basibranchial; bh, basihyal; cb, ceratobranchials; ch, ceratohyal; ep, ethmoid plate; m, Meckel’s cartilage; pch, parachordal; pq, palatoquadrate; tr, trabecula. Anterior towards the left. Scale bar: 100 µm EXPRESSION / LABELING:
|
|
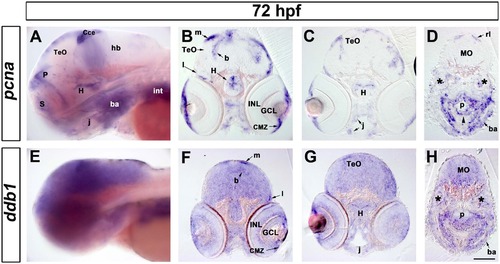
Expression of ddb1 in proliferation regions in wild type larvae at 72 hpf. (A-H) Characterization of pcna (A-D) and ddb1 (E-H) expression in wild type larvae at 72 hpf. Lateral views (A, E) and sections (20 µm; B-D, F-H). (A, E) ddb1 was broadly expressed in the brain while pcna was restricted to proliferation zones. (B-D, F-H) In the medial (m), lateral (l) and basal (b) proliferation zones of the tectum opticum (TeO) and the hypothalamic proliferation zone (H), elevated expression of ddb1 was detected compared to other areas of the brain. ddb1 was also highly expressed in the ciliary marginal zone (CMZ) and in proliferation regions of the pharyngeal endoderm (p) (black arrow head), jaw (j) and branchial arches (ba). The expression of ddb1 was also found in pcna-negative regions such as the ganglion cell layer (GCL) and inner nuclear layer (INL) of the retina. Transcripts of ddb1 were detected throughout the medullar oblongata (MO) where pcna was only expressed in the dorsal part, the rhombic lip (rl). Anterior towards the left. Stars mark the otic vesicle. Scale bar: 100 µm. EXPRESSION / LABELING:
|
|
Enhanced apoptosis in proliferation regions of the ddb1m863 mutant CNS. (A-F) The pcna expression pattern in ddb1m863 mutants and wild type siblings at 30 hpf (A-B) and 72 hpf (C-F). (G-J) TUNEL assay for apoptosis in ddb1m863 mutants (H-H′, J) and wild type siblings (G-G′, I) at 72 hpf. Embryos or larvae in lateral (A-B, E-H) and ventral views (C-D). Cross sections (20 µm; I-J) from larvae by TUNEL assay. Arrows represent affected pcna-expressing cells or enhanced apoptotic cells in the retina (D, J; red), pretectal region (F, J; blue), and cerebellum (F; green). Abbreviations used: ba, branchial arches; CMZ, ciliary marginal zone; Cce, cerebellum; GCL, ganglion cell layer; hb, hindbrain; H, hypothalamus; INL, inner nuclear layer; int, intestine; P, pallial proliferation zone; PO, preoptic area; tpz, tectal proliferation zones; Anterior towards the left. Scale bars in H′ for G′ and H′, in J for all of others: 100 µm. EXPRESSION / LABELING:
PHENOTYPE:
|
|
Increase of p53 transcript levels in ddb1m863 mutants. (A-D) Lateral (A-D) and dorsal views (inserts in A, C) of p53 expression pattern in embryos at 36 hpf (wt, n = 30; mut, n = 8) and 48 hpf (wt, n = 25; mut, n = 11). The transcription of p53 was prominently enhanced in ddb1m863 mutant embryos. Anterior towards the left. Abbreviations used: ba, branchial arches; Cce, cerebellum; end, endoderm, H, hypothalamus, hb, hindbrain; j, jaw; pfb, pectoral fin bud; tel, telencephalon; TeO, tectum opticum. Scale bar: 100 µm |
|
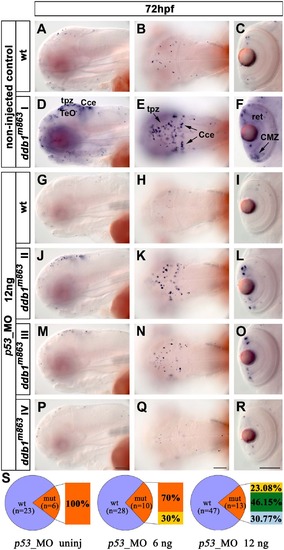
Knock down of p53 rescued the apoptosis phenotype of ddb1m863 mutants. (A-F) Enhanced apoptosis in ddb1m863 (class I phenotype; D-F) compared to wild type siblings (A-C) without p53_MO injection. (G-R) Partial (class II and class III; J-O) and complete (type IV; P-R) rescue of ddb1m863 apoptosis phenotype compared to wild siblings (G-I) after injection of 12 ng p53_MO per embryo. (S) Percentage distribution of mutant and rescued mutant phenotypes. Genotypes were determined by PCR. Class I (orange), mutants showed the severest apoptosis phenotype; class IV (light blue) mutants have the weakest phenotype with only a few of apoptotic cells, similar to their wild type siblings; class II (yellow) and III (green) are intermediate phenotypes. Abbreviations used: tpz, tectal proliferation zone; Cce, cerebellum; ret, retina; Anterior towards the left. Scale bar: 100 µm. PHENOTYPE:
|
|
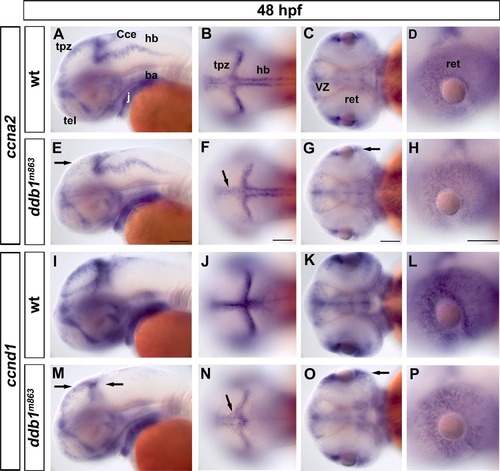
Reduced ccna2 and ccnd1 expression in ddb1m863 mutant embryos. (A-D) Expression pattern of ccna2 in wild type siblings. (E-H) Slight reduction of ccna2 expression was detected in the tpz (arrow in E-F) and CMZ (arrow in G) in ddb1m863 mutants. (I-P) The expression pattern of ccnd1 in wild type and homozygous ddb1m863 embryos. The transcripts of ccnd1 were slightly decreased in homozygous mutants (M-P). Arrows represent the altered expression of ccnd1 in the tectal proliferation region (M, N), cerebellum (M), and retina (O, P). Abbreviations used: ba, branchial arches; Cce, cerebellum; j, jaw; hb, hindbrain; tel, telencephalon; ret, retina; tpz, tectal proliferation region; VZ, ventricular zone. Anterior towards the left. Scale bars: 100 µm. EXPRESSION / LABELING:
|
|
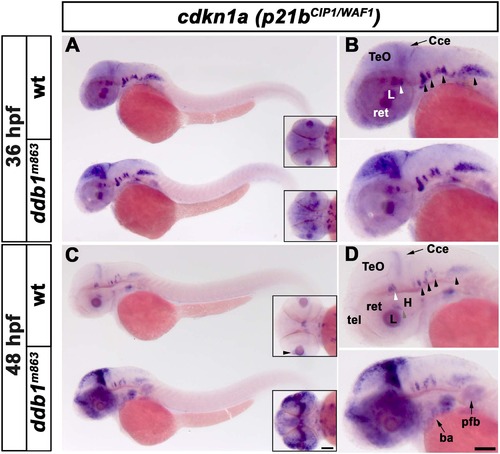
Increased p21bCIP1/WAF1 expression in homozygous ddb1m863 mutants. (A-B) Enhanced expression of p21bCIP1/WAF1 (cdkn1a) in ddb1m863 homozygous embryos in the proliferation regions of the optic tectum, compared to wild type siblings at 36 hpf. (C-D) At 48 hpf, p21bCIP1/WAF1 expression was strongly elevated in proliferation regions of the optic tectum, cerebellum, telencephalon, retina, branchial arches and pectoral fin bud in ddb1m863 mutants compared to wild type siblings. In contrast, expression of p21bCIP1/WAF1 in ventral hindbrain nuclei (arrow heads in B, D) was unaltered in ddb1m863 mutants. All views are lateral except for inserts (dorsal views). Abbreviations used: Cce, cerebellum; H, hypothalamus; L, lens; pfb, pectal fin bud; ret, retina; tel, telencephalon; TeO, tectum opticum. Anterior towards the left. Scale bar: 100 µm. |
|
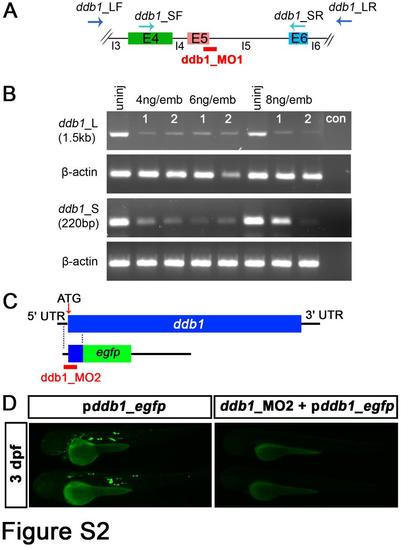
Evaluation of the knockdown efficiency of ddb1 morpholinos. (A-B) RT-PCR to test the efficiency of ddb1 splice site targeted morpholino (ddb1_MO1). (A) Schematic diagram of ddb1_MO1 targeting the 5th exon-intron junction. (B) Efficiency assay of ddb1_MO1 by RT-PCR using two pairs of ddb1-specific primers. The amount of RNA and cDNA used for RT-PCR was the same for the different samples and for the internal control β-actin. Negative control (con) contained no cDNA. (C-D) Evaluation of the knockdown efficiency of ddb1 translation start site morpholino (ddb1_MO2). (C) Schematic representation of ddb1-egfp fusion construct used for ddb1_MO2 efficiency assay. (D) The expression of EGFP in larvae injected with ddb1-egfp fusion construct together with or without ddb1_MO2. Anterior towards the left. Abbreviations used: E4/E5/E6, 4th /5th /6th exon; I4/I5/I6, 4th / 5th / 6th intron; ddb1_LF/R, the forward and reverse primers of longer ddb1-specific fragment; ddb1_SF/R, forward and reverse primers of shorter ddb1-specific fragment; 1 and 2, different samples; uninj, uninjected embryos. |
|
Dopaminergic phenotype in zebrafish larvae injected with ddb1_MO1. (A-I) The th expression pattern in wild type control larvae (A-C), in larvae injected with ddb1_MO1 (4 ng/embryo) (D-F), and larvae injected with ddb1_MO1 (4 ng/embryo) and the same amount of p53_MO (G-I) was analyzed by WISH. (A, D, G) lateral views and (B-C, E-F, H-I) dorsal views. Red arrows point at affected th-expressing neurons in the pretectum (D-E, G-H) and retina (F, I). Abbreviations used: AAN, arch-associated neurons; H, hypothalamus; LC, locus coeruleus; MO, medulla oblongata; OB, olfactory bulb; Pr, pretectum; PT, posterior tuberculum; SP, subpallium; sym, sympathetic neurons; VT, ventral thalamus. Anterior towards the left. Scale bar: 100 µm. EXPRESSION / LABELING:
PHENOTYPE:
|
|
Characterization of ddb1 expression pattern during wild type zebrafish embryonic development by WISH and RT-PCR. (A-I′) The WISH signal of ddb1 antisense probe (A-I) and its sense control (A′-I′) in embryos before 24 hpf. ddb1 transcript was ubiquitously detected in all blastomeres (A-F′) before mid-blastula transition (MBT) when zygotic transcription starts, revealing that ddb1 was expressed maternally. The ubiquitous expression was continued in subsequent stages including sphere, shield and 80% epiboly (G-I, G′-I′). (J-R) The expression of ddb1 at 24 hpf (J-L), 48 hpf (M-O), and 72 hpf (P-R). From 24 hpf onwards, ddb1 mRNA was observed to be expressed broadly and at high levels in the brain and somites (J-L), then spatially restricted to the brain, retina (high in the CMZ but moderate in the GCL and INL, M), the branchial arches, and endoderm at 48 hpf (N-O), followed at 72 hpf by downregulation and more distinct spatial expression pattern (P-R). ddb1 was detected at moderate levels in the telencephalic proliferation region, tectal proliferation region, cerebellum, CMZ, and branchial arches, whereas in other regions the signal was weak (P-Q). (S) ddb1 was maternally expressed as revealed by RT-PCR from two separate cDNA templates prepared from one cell stage zygotes (lanes 1 and 2; lane 3—control with water only as template) using a ddb1 specific primer pair. EXPRESSION / LABELING:
|
|
Reduction of ddb1 mRNA in homozygous ddb1m863 mutants by WISH and RT-PCR. (A-I) WISH analysis of ddb1 transcripts revealed reduced expression in heterozygous (B, E, H) and near-absent expression in homozygous ddb1m863 mutants (C, F, I) compared to wild type siblings (A, D, G) at 24 hpf (A-C) and 72 hpf (D-I). Planes focus on the retina of heterozygous embryos (B′) and homozygous mutants (C′). Lateral views (A-C; G-I) and dorsal views (D-F). Abbreviations used: Cce, cerebellum; dc, diencephalon; hb, hindbrain; j, jaw; I, lens; li, liver; mb, midbrain; ret, retina; sc, spinal cord; T, tectum; tc, telencephalon. Anterior is towards the left. Scale bars in C′ for B′-C′, in I for others: 100 µm. (J) RT-PCR analysis of ddb1 transcript levels during development stages from 24 hpf to 96 hpf in wild type, heterozygous and homozygous m863 mutants. β-actin was used as an internal control, and the negative control was template-free. (K) The RT-PCR gel was quantified densitometrically and traces of ddb1 PCR signal and of internal β-actin control were shown together with the wild type, heterozygous and homozygous m863 mutant samples adjacent to each other within each frame showing one developmental stage. Transcription of ddb1 was progressively downregulated in wild type embryos along the development. Compared to wild type siblings, the transcription level of ddb1 was slightly decreased in heterozygous embryos/larvae, but strongly reduced in homozygous ddb1m863 mutants. |

ZFIN is incorporating published figure images and captions as part of an ongoing project. Figures from some publications have not yet been curated, or are not available for display because of copyright restrictions. PHENOTYPE:
|

Unillustrated author statements |


