
- Title
-
Betaglycan knock-down causes embryonic angiogenesis defects in zebrafish
- Authors
- Kamaid, A., Molina-Villa, T., Mendoza, V., Pujades, C., Maldonado, E., Ispizua Belmonte, J.C., López-Casillas, F.
- Source
- Full text @ Genesis
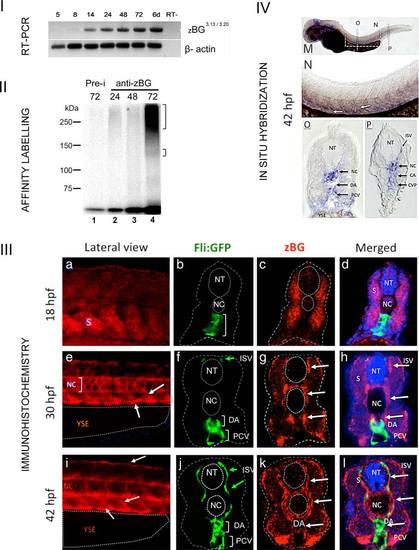
Expression of BG in zebrafish embryos. I: RT-PCR analysis of BG mRNA expression. Electrophoresis in agarose gel of samples corresponding to the RT-PCR products from T/W embryos RNA using the primers for zebrafish BG (see experimental procedures and Supporting Information Fig. S1). A single band of was obtained, corresponding to the expected 738 bp product of BG cDNA. This band was only detected at stages 14 hpf or later. Beta-actin was used as a loading control, and RT- indicates the control without reverse transcriptase enzyme. II: BG protein expression in zebrafish embryos. Electrophoresis in polyacrylamide gel- Samples correspond to total protein extracts that were subjected to TGF-β2 binding followed by immunoprecipitation with rabbit anti-zBG serum # 31, and crosslinking as described in Materials and Methods (see Supporting Information Fig. S1). From 24 to 72 hpf (lanes 2-4), the anti-BG serum detected a labeled smeary band centered around 250 kDa, as well as faint sharper band at ~120-130 kDa. Control was done with preimmune serum (Pre-i, lane1, corresponds to 72 h). III a-l: Immunohistochemistry (IHC) in TW embryos. Representative examples of embryos processed for IHC using a rabbit antiserum generated against zebrafish BG. a, e, and i: Lateral views of the trunk at the level of caudal limit of the YSE at the indicated stages. Red staining corresponds to BG expression. Anterior is to the left, dorsal to top. b-d, f-h, j-l: Transversal sections of Tg(fli:EGFP)y1 embryos at the level of the YSE at the indicated stages. Dotted lines were added to help identify the limits of the ectoderm, the neural tube and the notocord. b: At 18 hpf, GFP expression was found in ECs in the future DA and posterior Caudal Vein (PCV) (white bracket). c: In the same section high BG expression was localized in somites and low or absent in the notochord (NC). d: Merged image including DAPI staining of nuclei. e: Lateral views of the trunk of a 30 hpf embryo showing high expression of BG in the ventral aspect of somites, intersomitic boundaries (arrows) and NC (bracket). f: At 30 hpf, GFP expression was found in the DA and PCV and ISV. Note that in this section only the dorsal most tip of ISVs is seen (green arrow). g: In the same section, BG expression (white arrows) was high in cells at periphery of ventral somites, the NC and surrounding the neural tube. h: Merged image showing that sites of BG expression sites are adjacent to the DA, PCV, and ISV. i: Lateral views of the trunk of a 42 hpf embryo showed expression of BG similar to 30 hpf (white arrows), including now the dorsal aspect where the DLAV develops. j: At 42 hpf GFP expression indicated ECs of the DA, PCV, and ISV (green arrows). k: Note that BG expression was localized at higher levels (white arrows) in the NC and cells immediately adjacent to it, as well as the periphery of somites and neural tube. l: Merged image showing that sites of high BG expression are adjacent to GFP positive cells of the DA, PCV, and ISV. Abbreviations: Notochord (NC), Neural Tube (NT), ISV, Caudal Artery (CA), Posterior Caudal Vein (PCV), YSE, Somite (S)-. IV (m-p): “Whole-mount In situ hybridization” in TW embryos. Representative example of embryo processed for ISH using a riboprobe specific for zebrafish BG (nucleotides 1-861 of the cloned cDNA). m: Lateral view of a whole embryo at 42 hpf. Dotted rectangle indicates the magnified region shown in N. n: Lateral view at higher magnification of the indicated regions of embryo in M. BG expression was found in ventral somites and intersomitic boundaries. o: transverse cryostat section at the level of the YSE (indicated in M) showing expression of BG in the NC and somitic cells surrounding DA and PCV (black arrows). p: transverse cryostat section at the level of the CVP (indicated in M) showing expression of BG in the NC and somitic cells surrounding DA and CVP (black arrows) and ISV. Abbreviations: Notochord (NC), Neural Tube (NT), ISV, Caudal Artery (CA), Posterior Caudal Vein (PCV), YSE, Caudal Vein Plexus (CVP), and ISV. EXPRESSION / LABELING:
|

Phenotype of BG morphant embryos. Representative examples of Tg(fli:EGFP)y1 embryos, that were injected with 7 ng of mo-BG02 (b-d), or its control mismatched morpholino mo-BG02-mis (a, see Supporting Information Table S1 for nucleotide sequences) illustrating the main macroscopic features of “mild”, “moderate” and “severe” morphants at 30 hpf. Note that in d, three embryos are shown in the picture. a′-d′: The same embryos shown in a-d showing GFP fluorescence to illustrate vascular defects. Arrows point to DLAV in control, and white asterisks indicate examples of defective ISVs without DLV connections. Bracket in control indicates caudal vein plexus (CVP). a′′-d′′: merged images. Snapshots of a representative time-lapse imaging experiment, showing vascular development in control and mo-BG02 injected Tg(fli:EGFP)y1 embryos (e). Images correspond to lateral views of live embryos, at the anterior limit of the CVP, around somites 15-16th. Upper panel corresponds to control (mo-BG02-mis) and lower panel to a mild zBG morphant, injected with 7 ng of mo-BG02. All images were taken with two-photon confocal microscope as described in materials and methods, and correspond to Supporting Information movie S1 and movie S2. Pictures were extracted from the time-lapse series at the approximated times indicated. Dotted line indicates the dorsal aspect where the DLAV forms. Red arrowheads in control (upper panel, 24-32 hpf), indicate sprouts from the CVP. White arrows in mo-BG02 (lower panel 28 hpf) indicate morphant ISV sprouts that reached the dorsal aspect. Yellow arrows (lower panel 36-40 hpf) indicate aberrant connections between adjacent ISVs. Note that the developing CVP in mo-BG02-injected is largely devoid of the ventral sprouts and varicosities found in control, resulting in a dysmorphic CVP at 40hpf. |
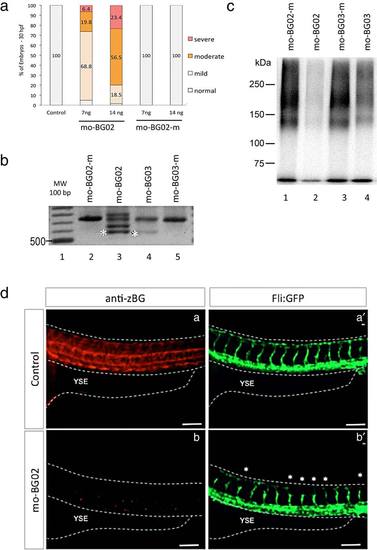
Morpholino BG knockdown. (a) Graph showing the effects of two different doses of mo-BG02 (7 and 14 ng) and its mismatch-control. Results are expressed as percentage of the total embryos in each category (mild, moderate, and severe), evaluated at 36 hpf. Morpholino identity and concentration are indicated in the horizontal axis. (b): Agarose gel showing the effects of mo-BG02, mo-BG03, and their mismatched controls on BG pre-mRNA splicing. TW embryos were injected with the indicated morpholinos, and total RNA was isolated at 72 hpf from 25 pooled embryos in each condition. Samples were processed for RT-PCR with primers 3.13 and 3.20 as described in experimental procedures. A single band corresponding to the expected 738 bp was obtained from embryos injected with control mismatch morpholinos (lanes 2 and 5). Injection with 7 ng of mo-BG02 (lane 3) produced the expected exon2-deletion product of 510 bp (band at asterisk) as well as several larger products (bands above asterisk) that correspond to aberrantly spliced mRNAs (see text). Injection of 30 ng of mo-BG03 (lane 4) produced the 510 bp PCR product (asterisk), but also large amounts of the WT product of 738 bp. (c) Autoradiography of acrylamide gel showing the effects of mo-BG02, mo-BG03, and their mismatched controls on the endogenous zBG protein. Wild type embryos were injected with the indicated morpholinos, total protein extracts were obtained at 72 hpf, and processed for TGF-β2 affinity labeling and immunoprecipitation with rabbit anti-BG serum # 31 as described in Materials and Methods and Supporting Information Figure S1. Treatments are as follow: mo-BG02-mismatch 7 ng (lane 1), mo-BG02 7 ng (lane 2), mo-BG03-mismatch 30 ng (lane 3), and mo-BG03 30 ng (lane 4). (d) IHC with anti-serum against zebrafish BG in wild type and morphant embryos. Lateral views of the trunk of Tg(fli:EGFP)y1 embryos the level of caudal limit of the YSE at at 36 hpf. Dotted lines were added to help identify the embryo limits. Anterior is to the left, dorsal to top. (d-a): Control embryo showing BG expression as described in Figure 3-III. (d-a′): the same embryo showing GFP expression in trunk vessels that have developed normally. (d-b): Mild morphant embryo injected with 7 ng mo-BG02 (mo-BG02) showed no expression of BG. (d-b′): the same embryo showing GFP expression in trunk vessels revealed the morphant phenotype of abnormal ISV development (asterisks). EXPRESSION / LABELING:
PHENOTYPE:
|

Angiogenic phenotype rescue with rat-BG mRNA. (a) Images correspond to lateral views of representative Tg(fli:EGFP)y1 embryos injected with 7 ng mo-BG02-mis (CONTROL), 7 ng mo-BG02 (mo-BG02), or 7 ng mo-BG02 together with 250 pg of in vitro transcribed rat-BG mRNA (mo-BG02 + rat-BG mRNA). Asterisks indicate examples of incomplete ISV. (b) Quantitative analysis of mo-BG02 effects and rat-BG mRNA rescue of ISV development. The number of ISVs that reached the dorsal aspect of the embryo (“complete ISV”) was counted in each embryo at 48 hpf, and the result was plotted as the proportion of all, complete and incomplete, ISVs. This ratio was close to one in control embryos (0.978 ± 0.005, N = 17), and in it was significantly reduced mild-morphants injected with 7 ng of mo-BG02 (0.393 ± 0.020 N = 28, two experiments, P < 0.0001). In embryos injected 250 pg of the rat-BG mRNA together with mo-BG02, the proportion of complete ISV significantly increased (0.6191 ± 0.01852 N = 35, two experiments, P < 0,001). (c) Quantitative analysis of mo-BG02 effects and rat-BG mRNA rescue of CVP development. The mean area (µm2) occupied by ECs in the ventro-caudal region of the Tg(fi1-eGFP)y1 line was measured at 2 dpf taking the YSE as the anterior limit and caudal aorta as dorsal limit, and plotted as Area CVP. In control embryos this area was (85610 ± 2329 N = 17), while the in mild morphant embryos injected with 7 ng mo-BG02, it was significantly reduced (46250 ± 1983 N = 27, two experiments, P < 0,001). This effect was partially rescued by rat-BG mRNA, resulting in the increased area of CVP compared to morpholino alone (70350 ± 1626 N = 37, two experiments, P < 0,001). |
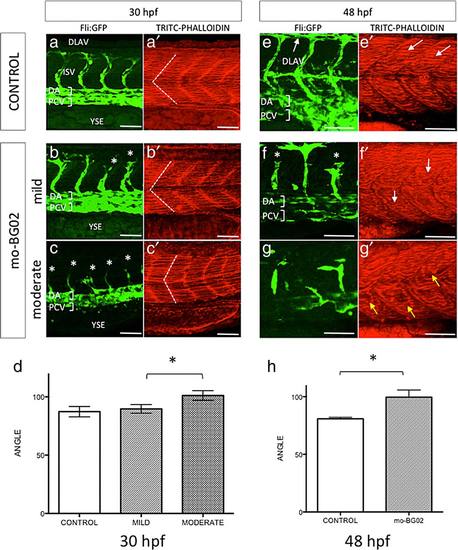
zBG morpholino knockdown effects in somite development. Lateral views of the trunk of zebrafish Tg(fi1-eGFP)y1 embryos, at the level of caudal limit of the YSE. All images correspond to maximal projections z-stack confocal images, at the indicated times and treatments. Scale bars correspond to 50 µm in all images. (a-c): GFP staining revealing ECs in control (a), mild morphants (b), and moderate morphants (c) at 30 hpf. a′-c3: TRITC-Phalloidin staining of the corresponding a-c images. White dotted lines indicates the intersomitic boundaries, and exemplifies the angles measured for each condition. (d) Quantification of morpholino effects on somite integrity at 30 hpf. Angle values and statistical analysis was done as described in materials and methods. Graph represents average ± SEM in each condition, and asterisks indicate statistical significance. Note that there is no significant difference between control (87.26 ± 1.582 N = 14 embryos) and mild morphants (89.61 ± 1.304; N = 18 embryos). (e-g): GFP staining revealing ECs at 48 hpf, corresponding to control (e), mild morphants (f), and moderate morphants (g). e′-g′: TRITC-Phalloidin staining of the corresponding e-g images. In all pictures white asterisks (*) indicate incomplete or malformed ISV. White arrows in e points to dorsal anastomotic vessels (DLAV). White arrows in e′ point to normal muscle fibers, and to abnormal curved fibers in mild morphant (f′). Yellow arrows point to regions deployed of actin-rich muscle fibers in moderate morphants (g′). (h): Quantification of morpholino effects on somite integrity at 48 hpf. Angle values and statistical analysis was done as described in materials and methods. Graph represents average ± SEM in each condition. Asterisks indicate statistical significance. At this stage, mild morphants (99.56 ± 6.209 N = 16) showed a significant increased angle respect to control (80.80 ± 1.319 N = 13, P < 0.0144). |

Pre-immune control of zebrafish BG Immunohistochemistry in TW embryos. Lateral views of the trunk of Tg(fli:EGFP)y1 embryos the level of caudal limit of the Yolk Sack Extension (YSE) at at 36 hpf. Dotted lines were added to help identify the embryo limits. Anterior is to the left, dorsal to top. (A): Embryo with anti-serum against zBG (#31) showing high expression of BG in the ventral aspect of somites, intersomitic boundaries and notochord (bracket). (B): Embryo stained with rabbit # 31 pre-immune serum. |

Morpholino effects on TW embryos. Images show the caudal region of Tab14/Wik embryos at 36 hpf that were processed for WM-ISH using a riboprobe specific for cadherin-5. Images show representative examples of control embryos injected with 7 ng of mo-BG02-mis (A), or morphant embryos injected with 7 ng of mo-BG02, and classified as mild (B) or moderate (C). Black Asterisks indicate examples of morphant ISVs. Abbreviations: Dorsal Longitudinal Anastomotic Vessel (DLAV), Intersegmental Vessel (ISV), Yolk Sack Extension (YSE), Caudal Vein Plexus (CVP). |
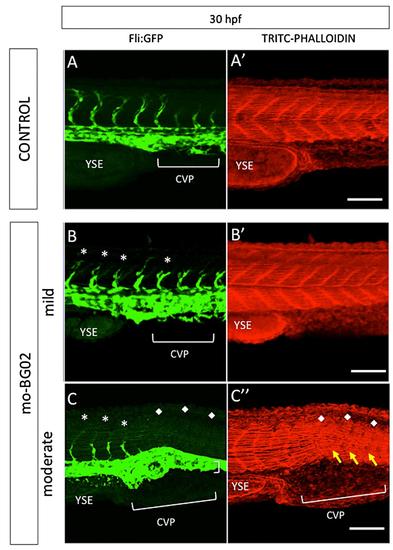
zBG morpholino knockdown effects in caudal somite development. Images correspond to maximal projections of z-stack confocal images, showing the caudal somites of zebrafish Tg(fi1-eGFP)y1 embryos at 30 hpf. Representative examples of control embryos injected with 7 ng of mo-BG02-mis (A-A′), or morphant embryos injected with 7 ng of mo-BG02, and classified as mild (B-B′) or moderate (C-C′). GFP staining reveals endothelial cells in control (S5-A), mild morphants (S4-B), and moderate morphants (S5-C). A′-C′: TRITC-Phalloidin staining of the corresponding A-C images. In all pictures white asterisks (*) indicate incomplete or malformed Intersegmental vessels. White diamonds (♦) indicate total absence of ISVs in moderate morphants. Yellow arrows point to severely malformed somites in moderate morphants. Abbreviations: Intersegmental Vessel (ISV), Yolk Sack Extension (YSE), Caudal Vein Plexus (CVP) |