
- Title
-
NRP1 Regulates CDC42 Activation to Promote Filopodia Formation in Endothelial Tip Cells
- Authors
- Fantin, A., Lampropoulou, A., Gestri, G., Raimondi, C., Senatore, V., Zachary, I., Ruhrberg, C.
- Source
- Full text @ Cell Rep.
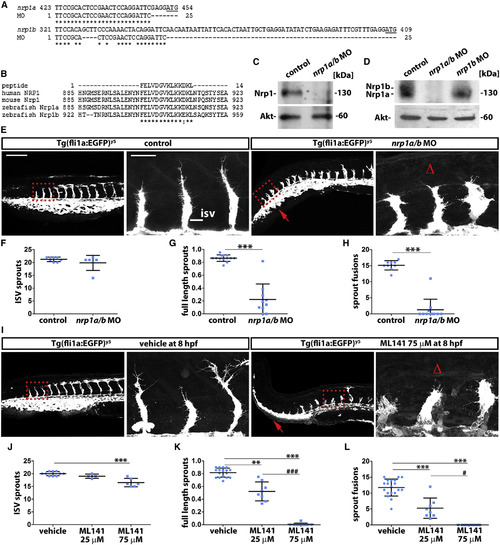
Vessel Sprouting Is Compromised by Nrp1 Knockdown or Cdc42 Inhibition in Zebrafish (A) Alignment of the nrp1a/b MO nucleotide target sequence with the 5′ UTR immediately upstream of the start codon (underlined) in nrp1a and nrp1b; asterisks indicate identical nucleotides. (B) Alignment of the peptide sequence recognized by anti-NRP1 antibody with the cytoplasmic tail of human and mouse NRP1 as well as zebrafish Nrp1a and Nrp1b; asterisks indicate identical amino acid residues, and the colon indicates a conservative substitution. (C and D) Protein lysates from control and nrp1a/b and nrp1b MO-injected 32-hpf fish embryos were used for Nrp1 and Akt immunoblotting after electrophoresis using a 10% gel (C) or 4%–12% gradient gel (D). (E–L) Confocal z stacks of trunks from 32 hpf Tg(fli1a:EGFP)y5 zebrafish and corresponding quantitation of the indicated vascular parameters for controls versus nrp1a/b MO (E–H) and vehicle versus ML141 treatment (I–L); scale bar, 200 µm. A kinked tail caused by Nrp1 knockdown is also seen after Cdc42 inhibition (red arrows). Boxed areas are shown at higher magnification adjacent to each corresponding panel to illustrate delayed sprout extension; scale bar, 25 µm. Δ indicates impaired sprout invasion into the dorsal trunk. The number of all ISV sprouts (F and J), full-length ISV sprouts (G and K), or ISV sprouts that have fused laterally (H and L) is shown as mean ± SD (n e 4 fish for each treatment condition). Asterisks indicate p values for nrp1a/b MO or ML141 relative to controls p < 0.01, p < 0.001; hashtags indicate p values for 75 µM relative to 25 µM ML141 #p < 0.05, ###p < 0.001. |
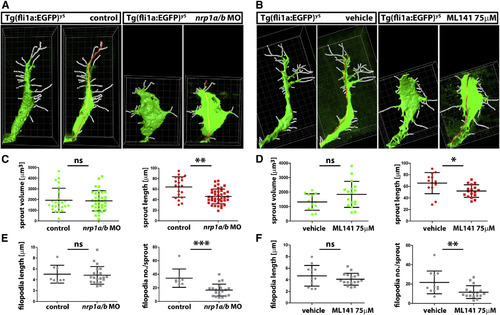
Cdc42 Inhibition Phenocopies Nrp1 Knockdown during Zebrafish Angiogenesis (A and B) Imaris image analysis of ISV sprouts in nrp1 morphant, ML141-treated and control embryos to determine sprout volume via surface rendering (left panel for each condition) and filament tracing to determine sprout length (red line in the right panel for each condition) and filopodia number as well as filopodia length (white lines). Grid ticks, 1 µm. (C–F) Quantitative analysis of the Imaris images exemplified in (A and B) for sprout volume and sprout length (C and D), filopodia length and filopodia number (E and F); mean ± SD, n e 8 sprouts for nrp1 morphant relative to control treated fish (C and E) and ML141- versus vehicle-treated fish (D and F); asterisks indicate p < 0.05, p < 0.01, p < 0.001, and ns > 0.05. |