- Title
-
Control of Wnt5b secretion by wntless modulates chondrogenic cell proliferation through fine-tuning fgf3 expression
- Authors
- Wu, B.T., Wen, S.H., Hwang, S.P., Huang, C.J., Kuan, Y.S.
- Source
- Full text @ J. Cell Sci.
|
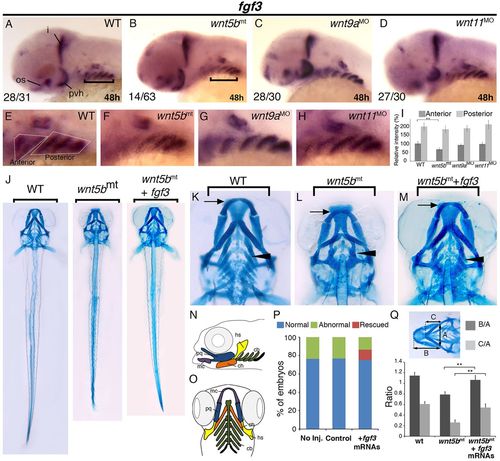
Ectopic expression of full-length fgf3 mRNAs rescues the jaw cartilage defects in wnt5b mutants. (A–D) Images showing fgf3 expression in wild-type (WT) (A), wnt5b mutant (wnt5bmt) (B), wnt9a-MO-injected (wnt9aMO) (C) and wnt11-MO-injected (wnt11MO) (D) embryos at 48hpf. i, isthmus; os, optic stalk; pvh, posterior-ventral hypothalamus. Brackets indicate the location where the prominent reduction of fgf3 expression is in the wnt5b mutant. (E–H) Enlarged pharyngeal regions from images in A–D. White dotted lines mark the regions of anterior or posterior pouches. (I) Signal intensity analyses for images E–H. (J) Images showing Alcian-Blue-stained jaw cartilages in WT larvae (left), or larvae injected with mRNA for wnt5bmt (middle) and wnt5bmt and fgf3 (wnt5bmt+fgf3) (right) at 96hpf. (K–M) Enlarged head regions from images in E. Arrows indicate the positions of Meckel′s cartilages. Arrowheads indicate where the ceratobranchial cartilages are. (N,O) Schematics showing the locations of Meckel′s cartilage (mc), and the ceratobranchial (cb), ceratohyal (ch), hyosymplectic (hs) and palatoquadrate (pq) cartilages. (P) The rescuing effects of fgf3 mRNA injection. The wnt5b ti265 allele is homozygous lethal, therefore normally only 25% mutants would be found in a given batch of embryos. The percentages of normal (blue bar), abnormal (green bar) and rescued (red bar) morphologies are 76.29%, 23.71% and 0% with no injection; 76.77%, 23.23% and 0% with control injection; and 75.14%, 13.7% and 11.16% with fgf3 mRNA injection. Phenotypes were scored at 4dpf from three independent experiments. (Q) Cartilage position analyses. The definition for A, B and C lines are described in the Materials and Methods. The B:A ratios (B/A) are 1.15 in WT, 0.79 in wnt5bmt, and 1.07 in wnt5bmt injected with fgf3 mRNAs. The C:A ratios (C/A) are 0.60 in WT, 0.26 in wnt5bmt, and 0.54 in wnt5bmt injected with fgf3 mRNAs. Images are lateral views in A–D and N; ventral views in E–H and O. Numbers in the bottom left corners in A–D indicate the number of the embryos showing the indicated phenotype and the total number examined (denominator). **P<0.05 |
|
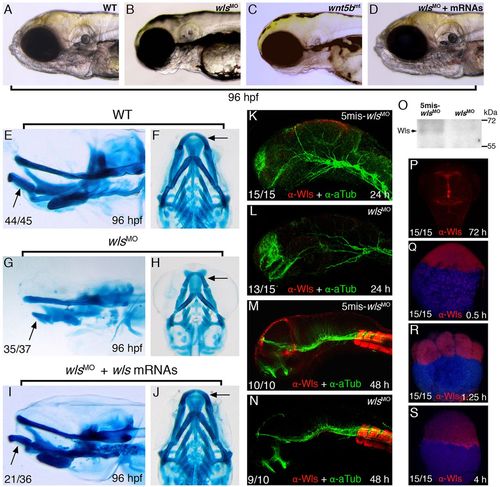
Wntless deficiency causes jaw cartilage defects that resemble the defects in wnt5b mutants. (A–D) Lateral views showing the head of 96 hpf WT (A), wls-MO-injected (wlsMO) (B), wnt5b mutant (wnt5bmt) (C) and wlsMO plus wls mRNA double injected (wlsMO+wls mRNAs) (D) larvae. (E–J) Images showing Alcian-Blue-stained jaw cartilages for (E,F) WT, (G,H) wlsMO, (I,J) and wlsMO plus wls mRNAs larvae at 96 hpf. Arrows indicate the Meckel′s cartilages. (K–N) Images showing wls control MO (5mis-wlsMO) (K,M) or wls MO-injected (L,N) embryos labeled with anti-Wls (red) plus anti-acetylated tubulin (green) antibodies at 24 (K,L) or 48 (M,N) hpf. (O) Cell lysates from control MO (left lane) or wls MO-injected (right lane) embryos detected by anti-Wls antibody in a western blot. (P–S) Images showing 72h (P), 0.5h (Q), 1.25h (R) and 4h (S) embryos labeled by anti-Wls antibodies (red) plus DAPI (blue in Q–S). Images are lateral views in A–D and E,G,I, ventral views in F,H and J, and a dorsal view in P. Numbers in the bottom left corners in E–S indicate the number of the embryos showing the indicated phenotype and the total number examined (denominator). EXPRESSION / LABELING:
PHENOTYPE:
|
|
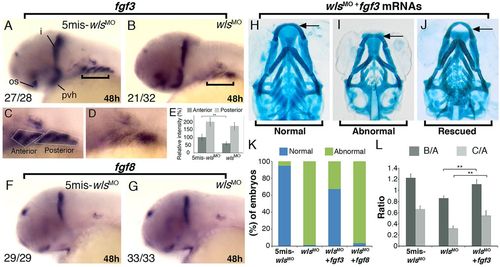
Ectopic expression of full-length fgf3 mRNAs rescues the jaw cartilage defects in wls morphants. (A,B) fgf3 expression in (A) control-MO-injected (5mis-wlsMO), and (B) wls-MO-injected (wlsMO) embryos. Brackets indicate the pharyngeal pouches where fgf3 expression is reduced. i, isthmus; os, optic stalk; pvh, posterior-ventral hypothalamus. (C,D) Enlarged pharyngeal regions from images in A,B. White dotted lines mark the regions of anterior or posterior pouches. (E) Signal intensity analyses for images shown in C and D. (F,G) fgf8 expressions in (F) 5mis-wlsMO or (G) wlsMO embryos at 48h. (H–J) Images of enlarged head regions from fgf3 mRNA and wlsMO double-injected (wlsMO+fgf3) larvae at 96h. Arrows indicate the Meckle′s cartilages. (K) Rescue of jaw defects by fgf3 mRNAs in wlsMO larvae. The percentages of normal (blue bar) and abnormal (green bar) morphology are 94.74% and 5.26% with 5mis-wlsMO; 1.22% and 98.78% with wlsMO; 67.24%, 32.76% with wlsMO and fgf3 mRNA co-injection; and 3.4% and 96.6% with wlsMO and fgf8 mRNA co-injection. Phenotypes of the embryos were scored at 4dpf from three independent experiments. (L) Cartilage position analyses. Definition for A, B and C lines are described in the Materials and Methods. Refer to Fig. 3Q for the definition of line A, B and C. The B:A ratios (B/A) are 1.23 in 5mis-wlsMO embryos, 0.86 in wlsMO embryos, 1.11 in wlslMO and fgf3 mRNA co-injected embryos and 0.85 in wlsMO and fgf8 mRNA co-injected embryos. The C:A ratios (C/A) are 0.66 in 5mis-wlsMO embryos, 0.31 in wlsMO embryos, 0.55 in wlsMO and fgf3 mRNA co-injected embryos. Lateral views are shown for images in A–D, ventral views are shown in E,G. Numbers in the bottom left corners in A, B, F and G indicate the number of the embryos showing the indicated phenotype and the total number examined (denominator). **P<0.05. |
|
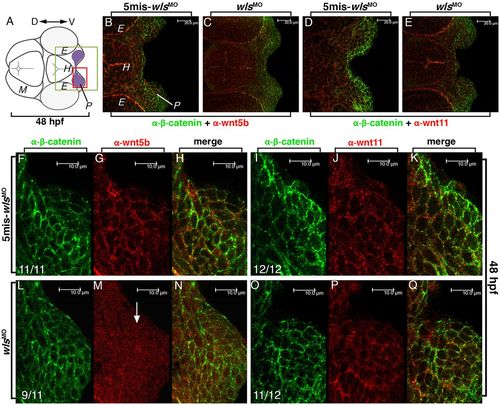
Wntless is required for Wnt5b secretion. (A) Cartoon showing cross-section view of the developing head of 48hpf embryos. E, eye; H, hypophysis; M, mesencephalon; P, denotes pharyngeal arch. Dorsal (D) is to the left, ventral (V) to the right. The green box indicates the pharyngeal region shown in images B–E. The red box indicates the region shown in images F–K. (B–E) Confocal images showing sections from the developing jaw of control-MO-injected (5mis-wlsMO) (B,D) wls-MO-injected (wlsMO) (C,E) embryos labeled by anti-β-catenin (in green) plus anti-Wnt5b (red in B,C) or anti-Wnt11 (red in D,E). (F–Q) Images showing enlarged pharyngeal regions from B–E. The arrow in M indicates the regions where Wnt5b is not accumulated on the cell membranes. All images were collected from embryos at 48hpf. Numbers in the bottom left corners in F–Q indicate the number of the embryos showing the indicated phenotype and the total number examined (denominator). |
|
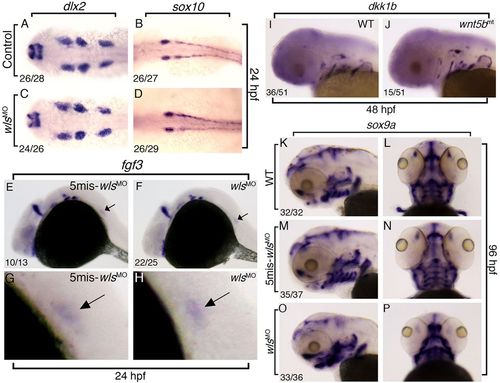
Migration and specification of neural crest cells are normal in wls morphants. (A–D) Dorsal views of 24 hpf control (5mis-wlsMO) (A,B) or wls-MO-injected (wlsMO) (C,D) embryos labeled with an antisense probe for dlx2 (A,C) or sox10 (B,D). (E–H) Lateral views of 24 hpf 5mis-wlsMO (in E) or wlsMO (in F) embryos labeled with the antisense fgf3 probes. Enlarged trunk regions from E and F are shown in G and H. Arrows indicate the migrating lateral line promodia. (I,J) Lateral views of 48 hpf WT (in I) or wnt5bmt (in J) embryos labeled with antisense dkk1b probes. (K–P) Images showing the sox9a expression in WT (K,L), wls 5mis-MO-injected (wlscMO) (M,N) and wlsMO (O,P) larvae at 96 hpf. Lateral views are shown in K,M,O; ventral views are shown in L,N,P. Numbers in the bottom left corners indicate the number of the embryos showing the indicated phenotype and the total number examined (denominator). |
|
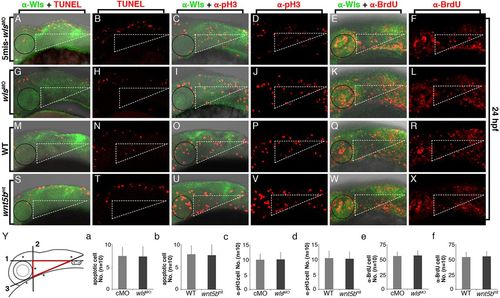
Chondrogenic cell survival and proliferation are unaffected in wls morphants at 24 hpf. (A–L) Confocal images showing lateral views of the heads of control-MO-injected (5mis-wlsMO) (A–F) or wls-MO-injected (wlsMO) (G–L) embryos stained by anti-Wls antibody (green in A,C,E,G,I,K) plus TUNEL (red in A,B,G,H), anti-pH3 (red in C,D,I,J) or anti-BrdU (red in E,F,K,L). The dotted lines of each triangle are defined as described in the Materials and Methods. The black circles indicate the position of the left eyes of the embryos. (M–X) Confocal images showing lateral view of the heads of WT (M–R) or wnt5b mutant (G–L) embryos stained by anti-Wls antibody (green in M,O,Q,S,U,W) plus TUNEL (red in M,N,S,T), anti-pH3 (red in O,P,U,V) or anti-BrdU (red in Q,R,W,X). (Y) The schematic on the left shows the three lines we defined to mark the region for counting the proliferating or apoptotic cells in the developing jaw (see Materials and Methods). (a–f) Statistical charts represent the quantitative results of apoptotic (TUNEL) or proliferating cells (pH3 or BrdU positive) at 24 hpf. There is no statistical difference between each set of these experiments. The n value is indicated. cMO, 5mis-wlsMO control. PHENOTYPE:
|
|
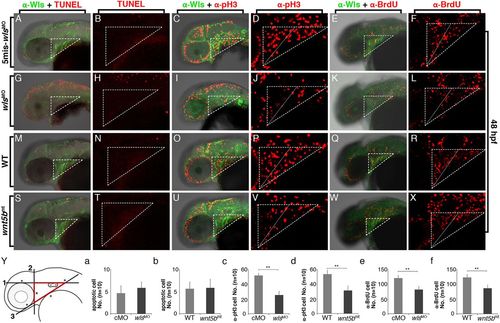
Wntless controls chondrogenic cell proliferation during jaw cartilage development. (A–L) Confocal images showing lateral views of the heads of control-MO-injected (5mis-wlsMO) (A–F) or wls-MO-injected (wlsMO) (G–L) embryos stained by anti-Wls antibody (green in A,C,E,G,I,K) plus TUNEL (red in A-B,G-H), anti-pH3 (red in C,D,I,J) or anti-BrdU (red in E,F,K,L). The dotted lines of each triangle are defined as described in the Materials and Methods. The unstained regions indicate the the left eyes of the embryos. (M–X) Confocal images showing lateral view of the heads of WT (M–R) or wnt5b mutant (G–L) embryos stained by anti-Wls antibody (green in M,O,Q,S,U,W) plus TUNEL (red in M,N,S,T), anti-pH3 (red in O,P,U,V) or anti-BrdU (red in Q,R,W,X). (Y) The schematic on the left shows the three lines we defined to mark the region for counting the proliferating or apoptotic cells in the developing jaw (see Materials and Methods). (a–f) Statistical charts represent the quantitative results of apoptotic (TUNEL) or proliferating cells (pH3 or BrdU positive) at 48 hpf. **P<0.05. The n value is indicated. cMO, 5mis-wlsMO control. PHENOTYPE:
|

