
- Title
-
Beneficial Bacteria Affect Danio rerio Development by the Modulation of Maternal Factors Involved in Autophagic, Apoptotic and Dorsalizing Processes
- Authors
- Miccoli, A., Gioacchini, G., Maradonna, F., Benato, F., Skobo, T., Carnevali, O.
- Source
- Full text @ Cell Physiol. Biochem.
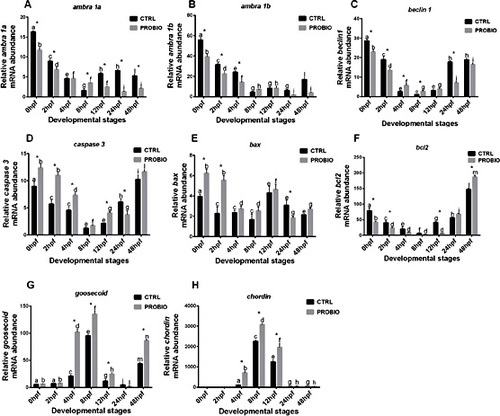
q-PCRs graphs reporting the temporal gene expression of ambra 1a1, ambra 1b, beclin 1, caspase 3, bax,bcl2, goosecoid and chordin. mRNA levels normalized against 18S for the control (CTRL) and treated (PROBIO) groups. Error bars indicate mean ± S.D. Data were processed with a Two-way ANOVA followed by Tukey multiple comparison test. Confidence interval was set at 95% (p < 0.05). |
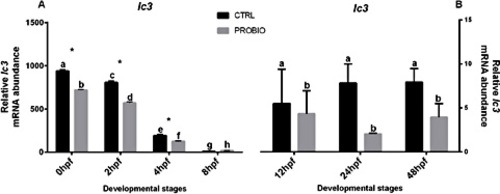
q-PCRs graphs reporting the temporal gene expression of lc3. mRNA levels normalized against 18S for the control (CTRL) and treated (PROBIO) groups. Error bars indicate mean ± S.D. Data were processed with a Two-way ANOVA followed by Tukey multiple comparison test. Confidence interval was set at 95% (p < 0.05). |

Whole Mount in situ Hybridization analysis of goosecoid and chordin expression in probiotic treated and control embryos. Analysis of goosecoid expression in embryos treated with the probiotic L. rhamnosus compared to control embryos at 4, 8, 12 and 48 hpf and of chordin expression in the same groups at 4, 8 and 12hpf. According to q-PCR results both markers are up-regulated at 4 hpf in probiotic treated embryos compared to controls, although the over-expression is more evident for chordin. At 8 hpf chordin expression seems to be reduced ventrally in probiotic treated group compared with controls. No clear differences were detected at the other developmental stages (scale bar: 200 µm). |