
- Title
-
Stimulation of hepatocarcinogenesis by neutrophils upon induction of oncogenic kras expression in transgenic zebrafish
- Authors
- Yan, C., Huo, X., Wang, S., Feng, Y., Gong, Z.
- Source
- Full text @ J. Hepatol.
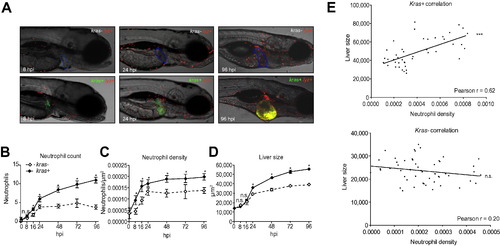
Recruitment of neutrophils to oncogenic liver. (A) Representative images of kras-/lyz+ and kras+/lyz+ larvae after 8, 24, and 96 hours of doxycycline induction starting from 3 dpf. The livers are outlined in blue dash lines in the upper images of kras-/lyz+ larvae and marked by GFP expression in the lower images of kras+/lyz+ larvae. (B–D) Time course of neutrophil count (B), neutrophil density (C) and liver size (D) following induction of oncogenic krasV12 expression in hepatocytes (n >15 from each group). Neutrophils were counted in the liver area and normalized against the liver size for liver density. Liver size was measured based on 2D images. (E) Correlation of liver size and neutrophil density in the liver. The measurements were based on 8 dpf larvae after 5 days of doxycycline induction. A positive correlation was observed only in the kras+ transgenic larvae (top) but not in the kras control group (bottom). Statistical significance: *p <0.05, **p <0.01, ***p <0.001. EXPRESSION / LABELING:
PHENOTYPE:
|
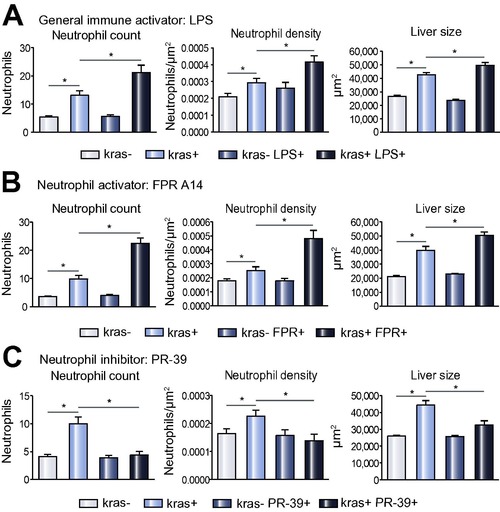
Effect of infiltrated neutrophils on liver size. (A-C) Neutrophil counts (left) and density (middle) in the liver area and liver size (right) in response to treatments of LSP (A), FPR A14 (B) or PR39 (C). Both kras-/lyz+ and kras+/lyz+ groups were similarly exposed to doxycycline from 3 dpf and neutrophils mediators were added from 4 dpf. Neutrophils and liver sizes were determined at 8 dpf (n >15 from each group). Statistical significance: *p <0.05. PHENOTYPE:
|
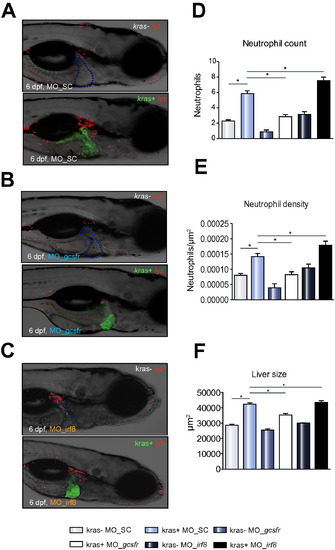
Effect of morpholino suppression of neutrophil differentiation and morpholino-mediated expansion of neutrophil population on liver size. (A–C) Representative images of 6 dpf kras-/lyz+ and kras+/lyz+ larvae injected with different morpholinos: Mo-SC (A), Mo-gcsfr (B) or Mo-irf8 (C). (D–F) Neutrophil counts (D) and density (E) in the liver area and liver size (F) after morpholino injection. n >15 in each group. Statistical significant: *p <0.05. |
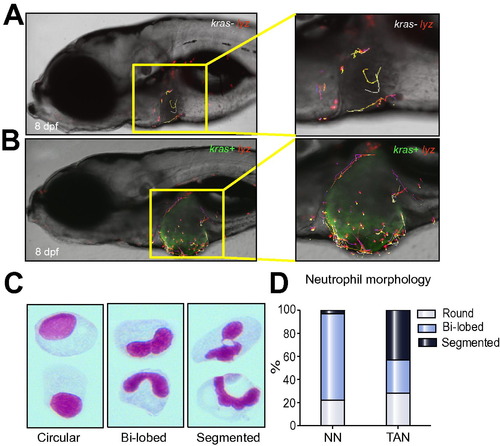
Differential behaviors of NNs and TANs. (A–B) Tracking of neutrophil movement within and surrounding the liver area in a kras-/lyz+ larva (A) and a kras+/lyz+ larva (B) respectively. Selected neutrophils were tracked based on one-hour time-lapse videos on 8 dpf larvae in Supplementary Videos 1 and 2. (C) Representative images of three distinct nuclear patterns after Giemsa staining: circular, bi-lobed and segmented nuclei. (D) Percentages of each nuclear pattern in NNs and TANs. |
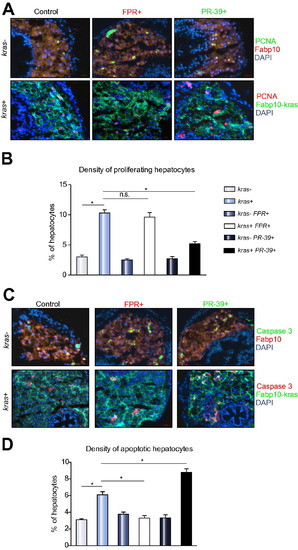
Proliferation and apoptosis analyses of effects of neutrophils on oncogenic hepatocytes. 8 dpf fabp10+ and kras+ larvae after exposure to FPR A14 or PR-39 with doxycycline were analysed by immunohistochemistry. (A and C) PCNA (A) or active caspase 3 (B) staining with representative images from each group. Control Fabp10+ larvae with DsRed expression in hepatocytes were stained with Alexa Fluor 488-conjugated secondary antibody after the primary antibody incubation (top rows) while kras+ larvae with GFP expression in hepatocytes were stained with Alexa Fluor 568-conjugated secondary antibody (bottom rows). All sections were counter-stained with DAPI. (B and D) Quantification of proliferating (B) and apoptotic (D) hepatocytes as percentage of total hepatocytes (n = 10; *p <0.05; n.s., no significance). |
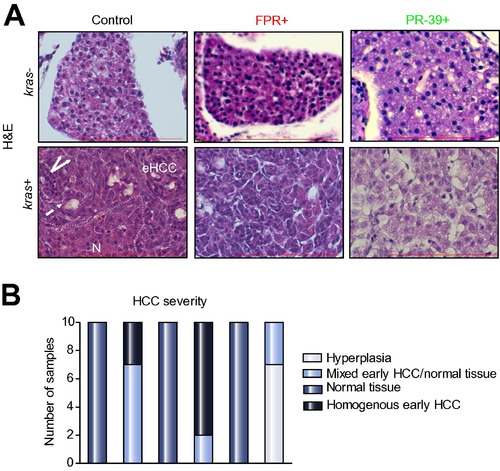
Histological analyses of effects of neutrophils on hepatocarcinogenesis. (A) H&E staining of liver sections. 8 dpf kras-/lyz+ and kras+/lyz+ larvae after exposure to FPR A14 or PR-39 with or without doxycycline, as indicated in the pictures, and were subject to H&E staining. Abbreviations: eHCC, early HCC; N, normal liver region. Dashed arrow: pseudo glandular pattern; white arrows: enlarged nuclei. (B) Quantification of phenotype observed in liver histology sections (n = 10, *p <0.05). PHENOTYPE:
|
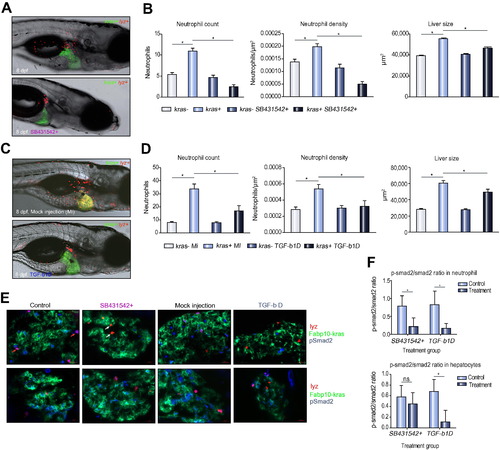
Effect of antibody-mediated Tgf-β depletion on TAN recruitment. (A) Representative images of 8 dpf kras+/lyz+ larvae exposed to either doxycycline alone (top) or with SB431542 (bottom). (B) Neutrophil counts (left) and density (middle) in the liver and liver size (right) after SB431542 treatment. (C) Representative images of 8 dpf kras+/lyz+ larvae injected with Tgf-β antibody (bottom) or mock injected as a control (top). Both were induced by doxycycline. (D) Neutrophil counts (left) and density (middle) in the liver and liver size (right) in Tgf-β-depleted (tgfb-1D) and mock injected (MI) larvae. (E) Validation of SB431542 exposure and Tgf-β depletion by immunostaining of Smad2 and phospho-Smad2 (pSmad2). Representative liver sections are shown from each group as indicated. The color code of each probes correspond the color signals in the images. Red arrows, DsRed expressing neutrophils with pSmad2 expression; white arrows, DsRed expressing neutrophils without pSmad2 expression. (F) Ratios of pSmad2/smad2 in neutrophils (top) and hepatocytes (bottom) in SB431542-inhibited and Tgf-β depleted larvae. n = 10; *p <0.05. |
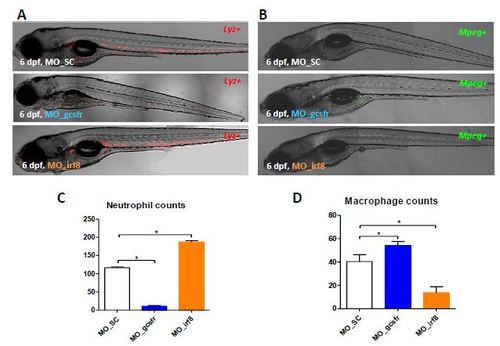
Effect of morpholino knockdown of Gcsfr and Irf8. (A) 6-dpf lyz+ larvae injected with morpholinos MO-SC (top), MO-gcsfr (middle) or MO_irf8 (bottom). (B) 6-dpf mpeg+ larvae injected with morpholinos MO-SC (top), MO-gcsfr (middle) or MO_irf8 (bottom). (C) Quantification of number of neutrophils per larva. (D) Quantification of number of microphages per larva. (n=5, *p<0.05). |
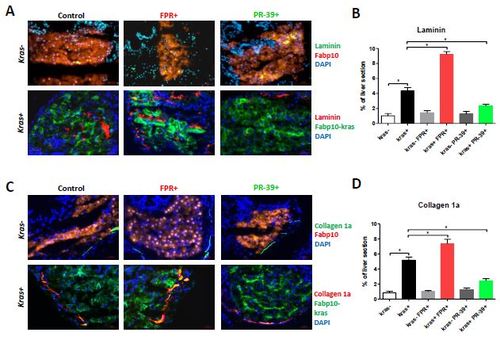
Effect of neutrophil infiltration on expression of Laminin and collagen I in the liver. 8-dpf fabp10+ and kras+ larvae after exposure to FPR-A14 or PR-39 with or without doxycycline were cryo-sectioned and immune-stained for Laminin and Collagen I expression. (A, B) Immuno-staining for Laminin (A) and quantification (B). (C, D) Immuno-staining for Collagen 1a (C) and quantification (D). Control fabp10+ larvae with DsRed expression in hepatocytes were stained with Alexa Fluor 488-conjugated secondary antibody after the primary antibody incubation (top rows) while kras+ larvae with GFP expression in hepatocytes were stained with Alexa Fluor 568-conjugated secondary antibody (bottom rows). All sections were counter-stained with DAPI. Treatment groups (n=10 each group) and color probes are indicated at the top and on the right respectively. Quantification of percentage of Laminin- or collagen I-positive areas out of total liver area is presented in (C) and (D). Statistical significance in quantification: *p<0.05. |
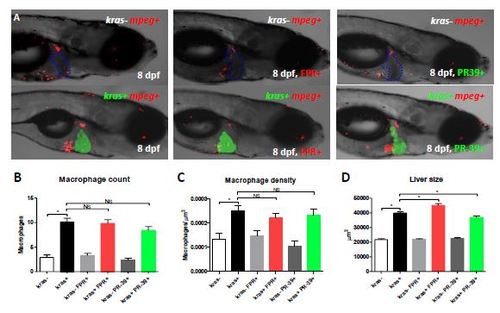
Lack of effect of FPRA14 and PR-39 on macrophages. (A) Representative images of 8-dpf kras-/mpeg+ (top row) and kras+/mpeg+ (bottom row) larvae treated with doxycycline alone (left), FPR-A14 and doxycycline ( middle) or PR-39 and doxycycline ( right) as indicated. Livers in kras- larvae are outlined. (B-D) Macrophage counts (B) and density (C) in the liver and liver size (D) after chemical treatment in the larvae (n>17 in each group). Statistical significant: *p<0.05. |
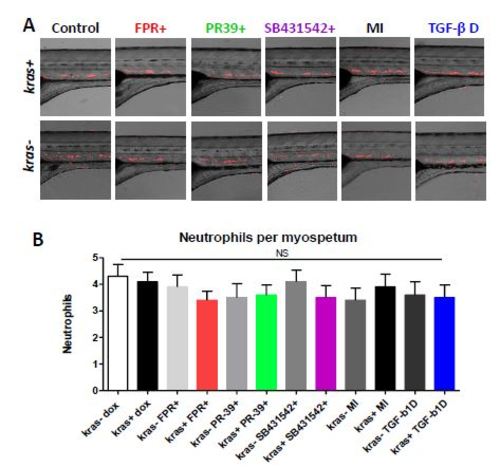
Lack of significant changes of neutrophil numbers under various experimental conditions. To support the specific changes of neutrophil numbers in the livers in various experimental conditions, the number of neutrophils were quantitated in the trunk region (somites 1-4). (A) Representative images of neutrophil distribution in the trunk of kras+ and kras- zebrafish larvae under various experimental conditions (from left to right), Control with doxycycline alone, FPR-A14 with doxycycline, PR39 with doxycycline, SB431542 with doxycycline, Mock injected, and Tgf-β depletion. (B) Quantification of numbers of neutrophils per somite among different treatment groups. (n=5 fish). NS, no significant difference. |
Reprinted from Journal of hepatology, 63(2), Yan, C., Huo, X., Wang, S., Feng, Y., Gong, Z., Stimulation of hepatocarcinogenesis by neutrophils upon induction of oncogenic kras expression in transgenic zebrafish, 420-8, Copyright (2015) with permission from Elsevier. Full text @ J. Hepatol.