FIGURE SUMMARY
Title

Developmental enhancers revealed by extensive DNA methylome maps of zebrafish early embryos

Authors
Lee, H.J., Lowdon, R.F., Maricque, B., Zhang, B., Stevens, M., Li, D., Johnson, S.L., Wang, T.
Source
Full text @ Nat. Commun.

Global features of DNA methylation across zebrafish embryogenesis

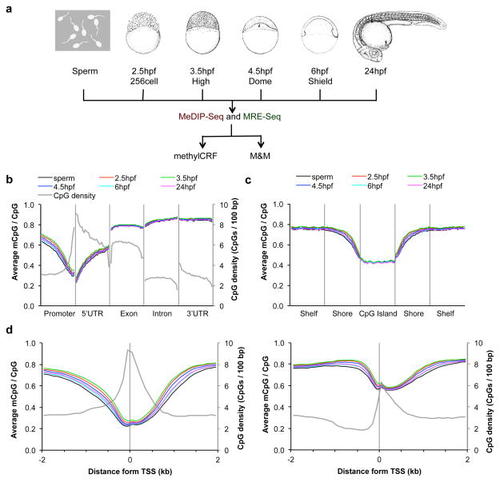
(a) A schematic representation of the study. MeDIP-seq and MRE-seq libraries were constructed from genomic DNA of six developmental stages: sperm, 2.5 hpf, 3.5 hpf, 4.5 hpf, 6 hpf and 24 hpf. Stage-specific drawings of representative embryos are adapted from ref 26 with permission from Wiley-Liss, Inc. © 1995. The two sequencing libraries for each developmental stage were further processed and analyzed using recently developed algorithms, methylCRF and M&M. Both algorithms integrate MeDIP-seq and MRE-seq data. (b–d) The average DNA methylation level across different genomic features: gene-associated regions (b), CpG islands and neighboring regions (c), and high and low CpG density promoters (d). Promoter was defined as 1 kb upstream from TSS in (b). CpG island shore was defined as 2 kb regions flanking a CpG island, and CpG shelf as a 2 kb region outside a CpG shore (away from the CGI). The average CpG densities (grey lines) over the regions was also plotted in (b) and (d).

Identification of the developmental stage-specific differentially methylation regions (dsDMRs)

(a) The number of dsDMRs identified between neighboring developmental stages as indicated on x-axis. Plus sign (+) indicates dsDMRs with increasing DNA methylation levels with respect to step-wise developmental stages, and minus sign (−) indicates dsDMRs with decreasing DNA methylation. The genomic locations of dsDMRs were indicated by different colors. Pie chart: the genomic locations of all DMRs identified in pair-wise comparisons. (b) The distribution of dsDMRs around genes related to embryo development (red) or around random genes (blue). (c) Sequence conservation of dsDMRs. Vertebrate PhastCons scores of the dsDMRs and their flanking 10 kb regions were averaged and plotted. (d) A weighted Venn diagram of the number of dsDMRs overlapping with histone modification peaks from any developmental stages. (e) Histone modification signature of dsDMRs. Average histone modification ChIP-seq RPKM values from 24 hpf embryos were plotted over 10 kb regions centered on dsDMRs.

Most dsDMRs with decreasing DNA methylation level between 6 hpf and 24 hpf are developmental enhancers

(a) Averaged vertebrate PhastCons scores of 10kb regions centered on dsDMRs were plotted. (b) A weighted Venn diagram of dsDMRs overlapping with different histone modification peaks from 24 hpf embryo. (c) Histone modification signature of dsDMRs. Average ChIP-seq RPKM values from 24 hpf embryos were plotted over 10 kb regions centered on the dsDMRs. (d) Heat maps of ChIP-seq signal over 10 kb regions centered on individual dsDMRs. (e) Enriched GO terms and their binomial p-values from analyzing dsDMRs using GREAT42. The top 20 GO terms were displayed here and the full list of GO terms enriched was in Supplementary Fig. 11a. (f) Expression profiles of genes associated with dsDMRs from GO enrichment analysis across different developmental stages.

Gene regulatory network derived by dsDMRs

(a) Enriched transcription factor binding motifs in dsDMRs and their hypergeometric p-values from HOMER62. On the left sequence logo of each motif was displayed. The three motifs used in eye development regulatory network construction were indicated by blue colored text. The motifs with p-values less than 10−10 were displayed here, and the full list of enriched motifs was in Supplementary Fig. 13. (b) The putative gene regulatory network of the eye development derived from dsDMR analysis. The blue ovals were transcription factors whose motifs were enriched in dsDMRs. The genes in the grey boxes were the target genes identified in GREAT analysis. Arrows indicates that the transcription factors had their binding motifs in neighboring dsDMRs of the target genes. The genes colored in red were known sox2 target genes identified from ChEA68. (c) The gene set view of 4 genomic regions (chr8:3242750–3245750, chr8:3250489–3253489, chr17:44294595–44297595, chr17:44405250–44408250) from the Epigenome browser69,70. The left panel displayed the regions around lhx2b promoter and its nearby dsDMR enhancer (indicated by the black box). The right panel displayed the regions around otx2 promoter and its nearby dsDMR enhancer. Both dsDMRs had Sox2 and Otx2 binding motifs (red ticks), suggesting that sox2 could be an upstream regulator of these two TFs. (d) The methylation profiles of the lhx2b and otx2 promoters and their neighboring dsDMR enhancers (blue and red lines, left y-axis) and the expression profile of the two genes (green lines, right y-axis). Each gene expression level was normalized to the expression level of 1K-cell stage. (e) The gene set view of 7 genomic regions (chr13:6556250–6559250, chr13:6658232–6661232, chr13:29912750–29915750, chr13:29935250–29940750, chr13:29993060–29996060, chr13:30062750–30065750, chr13:30077750–30080750) from the Epigenome browser69,70. The displays of pitx3 (left), six3b (middle) and lhx5 (right) promoters and their nearby dsDMR enhancers were as in (c).

In vivo validation of dsDMR enhancers

(a) Epigenome Browser69,70 view of the six3a gene, neighboring dsDMR enhancers (six3a-e1, and six3a-e2, grey boxes) and cloned region for a negative control (six3a-ne1, and six3a-ne2, dark grey boxes). (b) GFP expression driven by the dsDMR enhancers of the six3a gene. (c) The methylation profiles of the six3a promoter and neighboring dsDMR enhancers (blue and red lines, left y-axis) and the expression profile of the six3a gene (green line, right y-axis). (d) Epigenome Browser view of the fgfr2 gene, neighboring dsDMR enhancers (fgfr2-e1, fgfr2-e2, fgfr2-e3, and fgfr2-e4, grey boxes) and cloned regions for negative controls (fgfr2-ne1, fgfr2-ne2, fgfr2-ne3, and fgfr2-ne4, dark grey boxes). (e) GFP expression driven by the dsDMR enhancers of the fgfr2 gene. (f) The methylation profiles of the fgfr2 promoter and neighboring dsDMR enhancers (blue and red lines, left y-axis) and the expression profile of the fgfr2 gene (green line, right y-axis). The asterisk * indicates that only one G1 transgenic line was established. Forebrain (f); midbrain hindbrain boundary (mh).

Acknowledgments
This image is the copyrighted work of the attributed author or publisher, and ZFIN has permission only to display this image to its users. Additional permissions should be obtained from the applicable author or publisher of the image. Full text @ Nat. Commun.