
- Title
-
In vivo imaging and characterization of actin microridges
- Authors
- Lam, P.Y., Mangos, S., Green, J.M., Reiser, J., Huttenlocher, A.
- Source
- Full text @ PLoS One
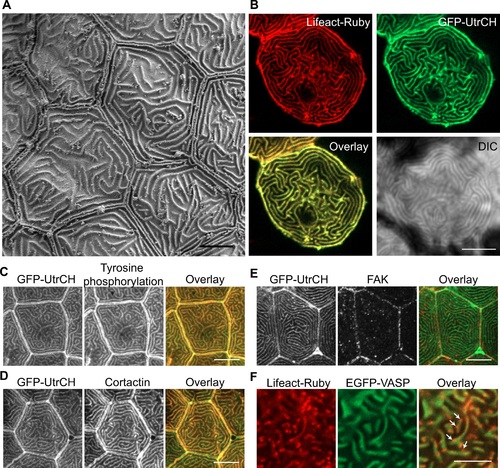
Microridge structure and composition. (A) Scanning electron microscopy on zebrafish larvae at 2 days post fertilization (dpf) in the area of the trunk. Scale bar, 5 µm. (B) Single plane confocal images of epithelial cells expressing actin bioprobes Lifeact-Ruby and GFP-UtrCH, which label all F-actin and stable F-actin, respectively. Signal from Lifeact-Ruby and GFP-UtrCH colocalize. Scale bar, 10 µm. (C-E) Tg(krt4-GFP-UtrCH) larvae at 2.5 dpf were fixed and immunostaining was performed using anti-phosphotyrosine antibody 4G10 (C), anti-cortactin antibody (D) or anti-FAK antibody (E). Scale bar, 10 µm. (F) Single plane confocal images of epithelial cells expressing actin bioprobe Lifeact-Ruby and EGFP-VASP. VASP localizes to a subset of Lifeact labeled microridges (S1 Movie). Arrows indicate regions of Lifeact labeling that did not colocalize with VASP. Scale bar, 5 µm. |
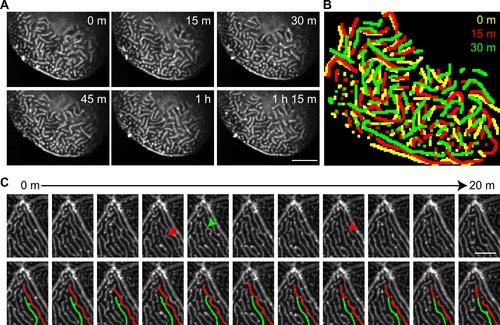
Microridges are dynamic in vivo. GFP-UtrCH was transiently expressed in epithelial cells in zebrafish larvae at 2.5 dpf. (A) Maximum intensity projection of confocal images showing changes in microridge pattern over time (S2 Movie). Scale bar, 10 µm. (B) Overlay of microridge pattern in the same cell at time points indicated. Microridges are color-coated to indicate patterns from different time points. (C) Time-lapse maximum intensity projection images showing how microridge patterns rapidly change by bending (red arrow), breaking (red arrowhead) and connecting (green arrowhead) (S3 Movie). (Top panel) Images acquired every 2 minutes are shown. (Bottom panel) Duplication of the top panel with two adjacent microridges labeled with pseudo-color to aid in the visualization of microridge dynamics. Scale bar, 5 µm. |

Microridge organization during cytokinesis and wounding. (A) Time-lapse maximum intensity projection images show changes in microridge pattern during cytokinesis at 30 hours post fertilization (S4 Movie). Mosaic transient expression of GFP-UtrCH in epithelial cells allows visualization of microridges. Microridges gradually became shorter before cytokinesis (i and ii). Microridges transiently disappear (iii; in cells labeled with green asterisk) shortly before the appearance of the cleavage furrow (iv and v; arrows); reappear quickly during cleavage furrow formation (iv and v; in cells labeled with red stars); and then gradually become longer after cytokinesis (vi; arrowheads). Data are representative of 6 individual cells from 3 zebrafish larvae. Scale bar, 10 µm. (B) Maximum intensity projection of epithelial cells expressing GFP-UtrCH alone (i) or with constitutive active Rho (Rho Q63L-mCherry; ii) in zebrafish larvae at 2.5 dpf. Active Rho expression in epithelial cells results in cell rounding and apical protrusion but microridges are maintained. YZ, maximum intensity projection on the YZ axis. Data are representative of 63 individual cells in 21 larvae from three separate experiments. Scale bar, 10 µm. (C) Rearrangement of microridges during epithelial wound healing in vivo. Laser cell ablation was performed on a single cell (red asterisk) in a zebrafish larva at 2.5 dpf that transiently expresses GFP-UtrCH in epithelial cells. Maximum intensity projection images before (i) and after laser ablation (ii and iii) show the change in microridge pattern and cell shape in the epithelial cells (green asterisk) adjacent to the wound (S5 Movie). Data are representative of 5 individual experiments. Scale bar, 10 µm. |

Rho GTPases regulate microridge organization. (A) Larvae at 2.5 dpf were treated with 25 µM Blebbistatin (Bleb) for 1 h to inhibit myosin II. 0.5% DMSO was used as a control. The length of microridges in the same cell before and after treatment was measured. Each data point represents the percentage change of the average microridge length in an individual cell after treatment. Data are representative of at least three different experiments. Each experiment was performed on at least 3 larvae, with measurements performed on 3–4 cells per larva. For details of the methods and analysis, refer to the Methods and Materials section. Efficacy of blebbistatin was confirmed by changes in neutrophil morphology and motility after treatment (data not shown). ns, not significant (two-tailed, unpaired t-test). (Right panel) Representative confocal images of GFP-UtrCH labeled microridges before and after treatment. Scale bar, 10 µm. (B) Maximum intensity projection of epithelial cells expressing Lifeact-Ruby alone (i) or with dominant negative RhoA (Dendra2-RhoA T19N) (ii) in zebrafish larvae at 2.5 dpf. Scale bar, 10 µm. Average distance between microridges (C) and cell area (D) in control or Dendra2-RhoA T19N expressing epithelial cells were measured and compared. Each data point represents the value from one cell. Data are collected from more than ten individual larva for each group from 3 separate experiments. **** P<0.0001 (two-tailed, unpaired t-test). (E) Maximum intensity projection of epithelial cells expressing GFP-UtrCH alone (i) or with dominant negative Rac2 (mCherry-2A-Rac2 D57N) (ii) in zebrafish larvae at 2.5 dpf. Scale bar, 10 µm. Average distance between microridges (F) and cell area (G) in control or mCherry-2A-Rac2 D57N expressing epithelial cells were measured and compared. Each data point represents the value from one cell. Data are collected from more than twelve individual larva for each group from 3 separate experiments. For details of the methods and analysis refer to the Methods and Materials section. **** P<0.0001; ns, not significant (two-tailed, unpaired t-test). |

Microridges are actively treadmilling. Inhibition of actin polymerization using Latrunculin A (LatA) (A) or inhibition of Arp2/3 using CK-666 (B) resulted in shortened microridges. Larvae at 2.5 dpf were treated with 1 µM LatA or 0.5% DMSO as controls for 30 minutes, or with 200 µM CK-666 or its inactive analogue CK-689 for 1 hour. (C) PI3K kinase activity is involved in maintaining microridge length. Larvae at 2.5 dpf were treated with 130 µM LY294002 for 1 hour to inhibit PI3K. 0.5% DMSO was used as a control. (Ai, Bi and Ci) The length of microridges in the same cell before and after treatment was measured and compared. Each data point represents the percentage change of average microridge length in one cell after treatment. Data are representative of at least three separate experiments. Each experiment was performed on at least 3 larvae, with microridge measurements on 3–4 cells per larva. For details of the methods and analysis refer to the Methods and Materials section. ** P<0.01; *** P<0.001 (two-tailed, unpaired t-test). (Aii, Bii and Cii) Representative confocal images of GFP-UtrCH labeled microridges before and after the respective treatments. Scale bar, 10 µm. (Aiii, Biii and Ciii) Representative scanning electron microscopy images of zebrafish larvae with the respective treatments. Scale bar, 10 µm |
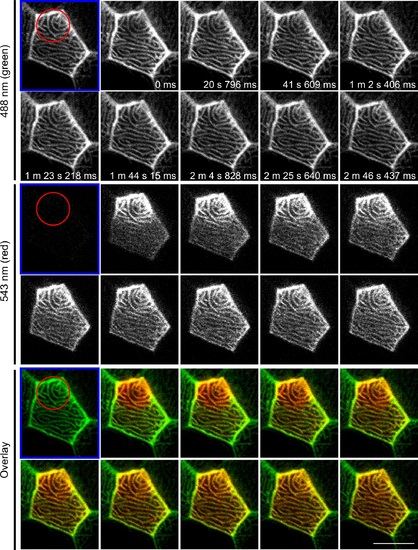
F-actin in microridges is highly dynamic. Photoconversion of actin-mEos was performed on 3 dpf larvae by focusing on a sub-region (red circle) of an epithelial cell displaying microridges in vivo and time-lapse images were taken before (labeled with blue frame) and after photoconversion. Upon photoconversion, mEos-actin is irreversibly converted from emitting a green to a red fluorescent signal. For details of photoconversion refer to Materials and Methods. Single plane of confocal image of red channel, green channel and overlay of the two are shown. Data are representative of 9 individual cells. Scale bar, 10 µm. See S7 Movie. |

Microridge structure during zebrafish development. (Ai—Aii) Scanning electron microscopy images on zebrafish embryo at 12 hour post fertilization (hpf). (Ai) Microridges were observed in epithelial cells that appeared to have recently undergone cytokinesis. Arrows indicate example of microridges. (B) SEM images at 1–5 and 9 day post fertilization (dpf) on the cornea, yolk and trunk region of zebrafish larvae. (C) SEM images of cornea at adult stage. Scale bar, 5 µm. |

Phospho-Myosin Light Chain antibody staining. Maximum intensity projection of confocal images show phospho-Myosin Light Chain (pMLC) antibody staining in Tg(krt4:GFP-UtrCH) larvae at 2.5 dpf. Scale bar, 10 µm. |
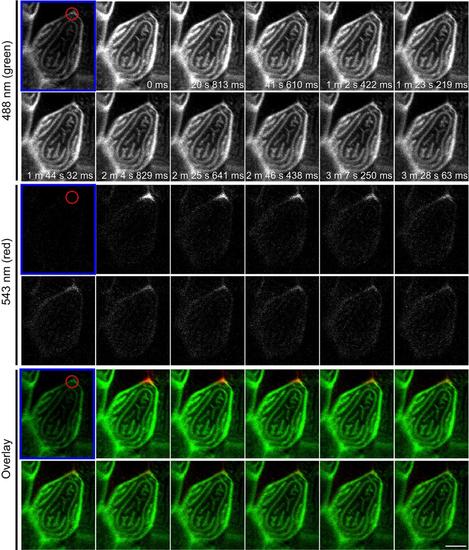
F-actin in microridges is highly dynamic. Photoconversion of actin-mEos was performed on 3 dpf larvae by focusing on a small region of an epithelial cell containing microridges (red circle) and acquiring time-lapse images before (labeled with blue frame) and after photoconversion. Upon photoconversion, mEos-actin is irreversibly converted from exhibiting green to red fluorescent emission. Data are representative of 15 individual cells. For details of photoconversion refer to Materials and Methods. Single plane of confocal image of red channel, green channel and overlay of the two are shown. Scale bar, 10 µm. See S6 Movie. |
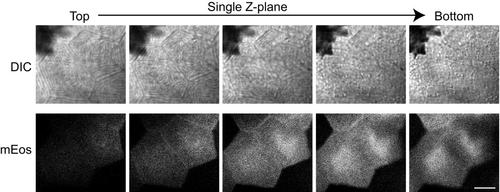
mEos expression in epithelial cells in vivo. Krt4-mEos was transiently expressed in epithelial cell. Single Z-plane of DIC or mEos at 1.9 µm step size was shown. Scale bar, 10 µm. |