
- Title
-
A Tethered Agonist within the Ectodomain Activates the Adhesion G Protein-Coupled Receptors GPR126 and GPR133
- Authors
- Liebscher, I., Schön, J., Petersen, S.C., Fischer, L., Auerbach, N., Demberg, L.M., Mogha, A., Cöster, M., Simon, K., Rothemund, S., Monk, K.R., Schöneberg, T.
- Source
- Full text @ Cell Rep.
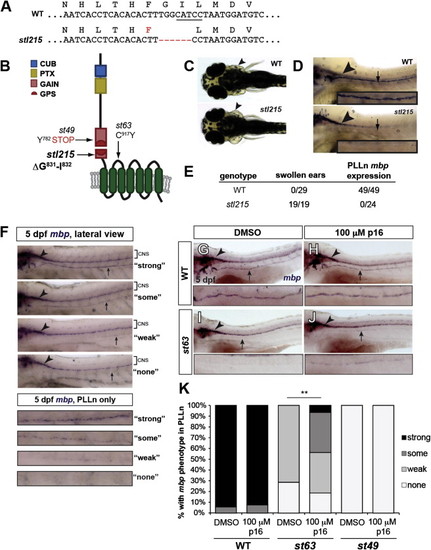
Tethered Agonistic Peptides Function In Vivo (A) Sequences of WT and stl215 alleles. stl215 is characterized by a 6 bp in-frame deletion, which results in the removal of aa Gly831 and Ile832. The BtsCI restriction enzyme site targeted by the TALEN is underlined. (B) Schematic representation of Gpr126 showing the stl215 allele compared with st49 and st63 alleles. (C) Dorsal view of 4 days postfertilization (dpf) larvae. Arrowheads indicate normal ear morphology in the gpr126+/+ larva (WT) and swollen ears in the gpr126stl215/stl215 larva (stl215). (D) Lateral view of whole-mount in situ hybridization (WISH) of zf larvae at 4 dpf. The posterior lateral line nerve (PLLn) is marked with an arrow; mbp expression in the CNS is indicated with an arrowhead. mbp expression can be observed in the CNS, but not in the PLLn of gpr126stl215/215 mutant larvae (st215). (E) Quantification of the swollen ear phenotype and PLLn mbp expression out of the total number of larvae scored per genotype (WT = gpr126+/+ and gpr126stl215/+). (F–J) WISH of 5 dpf larvae showing mbp expression in the CNS (arrowhead) and PLLn (arrow). (F) Scoring rubric for PLLn mbp expression; enlarged panels show the PLLn-only key. “Strong” = strong and consistent mbp expression, “some” = weak but consistent mbp expression, “weak” = weak and patchy mbp expression, “none” = no mbp expression. (G–J) The WT larvae treated with DMSO (G) or 100 µM p16 (H) have strong PLLn mbp expression. DMSO-treated gpr126st63/st63 mutants have reduced PLLn mbp expression (I), which is significantly rescued with peptide treatment (J). (K) Quantification of WISH experiments. Bars indicate the proportion of larvae with each PLLn mbp expression phenotype (as defined in F). p < 0.0001, combined gpr126st63/st63 mutants with “some” and “strong” versus combined gpr126st63/st63 mutants with “weak” and “none”; Fisher’s exact test. WT = gpr126+/+ and gpr126+/st63 siblings of gpr126st63/st63 mutants. n = 3 technical replicates, n = 105 WT (51 DMSO-treated, 54 peptide-treated), n = 53 gpr126st63/st63 (21 DMSO-treated, 32 peptide-treated), and n = 8 gpr126st49/st49 (4 DMSO-treated, 4 peptide-treated). See also Figures S3 and S4. |
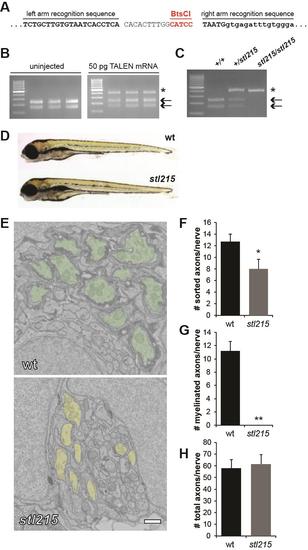
Agonistic peptide deletion ablates Gpr126 function in vivo, Related to Figure 4 (A) Left and right TALEN recognition sequences in gpr126. The unique restriction enzyme site targeted by the TALEN and used for restriction fragment length analysis is underlined in red. Uppercase letters indicate coding sequence, while lowercase letters represent the intronic region. (B) Restriction fragment length analysis of three representative uninjected control embryos and three embryos injected with TALEN mRNA (25 pg left arm, 25 pg right arm) at 24 hpf. The arrows mark wild-type fragments cleaved by BtsCI, while the asterisk marks the undigested product resulting from TALEN-mediated disruption of the restriction enzyme site. (C) Representative image of the stl215 genotyping assay using restriction fragment length analysis. The wt PCR product has an intact BtsCI site and the digest results in two fragments of 239 bp and 158 bp (arrows). The disrupted BtsCI site in stl215 results in an undigested PCR product (asterisk). (D) Lateral view of the morphology of a gpr126stl215/+ (wt) sibling and a gpr126stl215/stl215 mutant at 5 dpf. (E) Transmission electron microscopy (TEM) of cross-sections through the PLLn. To control for developmental variability along the anterior-posterior axis, all nerves were analyzed at approximately the same body segment (between segments 5-7) of 5 dpf zebrafish larvae. wt PLLn (top) have many myelinated axons (green), whereas Schwann cells in gpr126stl215 sort axons (yellow) but fail to spiral their membranes to form myelin. Scale bar = 500 nm. (F-H) Quantification of TEM images from PLLn of wt (gpr126+/+ and gpr126stl215/+) and gpr126stl215 5dpf larvae. For all, n=6 PLLn from N=4 wt larvae, and n=6 PLLn from N=4 mutant larvae. Error bars indicate standard deviation, significance determined via Student’s t-test. (F) Average number of sorted axons per PLLn in wt (12.7±1.4) and mutant (8±1.7) larvae. *p<0.001. (G) Average number of myelinated axons per PLLn in wt (11.1±1.5) and mutant (0±0) larvae. **p<10-8. (H) Average number of total axons per PLLn in wt (57.8±7.7) and mutant (61.5±8.1) larvae. No significant difference was observed (p>0.4). PHENOTYPE:
|

Rescue of st63 mutant zebrafish ortholog through p16 and influence of N-terminal positions on GPR126 activity levels, Related to Figure 4 (A) COS-7 cells were transiently transfected with wt, C917Y (gpr126st63) and ΔGly831-Ile832 (gpr126stl215) mutant zebrafish Gpr126 constructs and tested for cell surface expression and (B) basal and stimulated accumulation of cAMP. For the cell surface ELISA, the non-specific OD value (pcDps) was 0.003 ± 0.001 (set 0%) and the OD value of P2Y12 was 1.22 ± 0.33 (set 100%). Data are given as means ± SEM of at least two independent experiments each performed in triplicates. For cAMP assays, empty vector cAMP levels were 1.78 ± 1.12 nM/well. Data are given as means ± SEM of at least two independent experiments performed in triplicates. (C-D) Transmission electron micrographs (TEM) of 5-day post-fertilization (dpf) larvae showing crosssection through the PLLn. To control for developmental variability along the anterior-posterior axis, all nerves were analyzed at approximately the same body segment (between segments 5-7). (C) Myelinated axons are pseudocolored in green in a representative wt larva. (D) Myelinated axons are pseudocolored in green in a representative gpr126st63/st63 mutant larva. For (C-D), melanocytes laden with melanin granules are denoted by “pigment”. Scale bar = 1 µm. (E) To alter GPS structure, disulfide bridge-forming cysteines were systematically mutated to serine in GPR126 (C775S/ mutant C→S I, C794S/ mutant C→S II, C807S/ mutant C→S III and C809S/ mutant C→S IV). Interestingly, all mutants displayed constitutive activity in cAMP assay. In all cases, Cys mutations led to a reduction of cell surface expression levels indicating increased intrinsic activity of the mutants. COS-7 cells were transfected with wt and mutant GPR126 constructs. Basal cAMP levels were determined as described under Experimental Procedures. Specific cAMP levels (cAMP value of double HA/FLAG-tagged aGPCR constructs minus cAMP value of mock-transfected cells) were referred to the given wt receptor. Empty vector served as negative control (pcDps; cAMP level: 3.68 ± 2.54 nM/well). For GPR126, basal cAMP levels determined as x-fold over empty vector were 3.70 ± 1.20 (each set 100%). Data are given as means ± SEM of three independent experiments performed in triplicates. Statistics were performed by applying a one-way ANOVA in combination with Bonferoni as post-hoc test: *p<0.05; **p<0.01; ***p<0.001 (F) For expression studies, cell surface and whole cell ELISA were used to measure cell surface and total cellular expression levels, respectively. Specific optical density (OD) readings (OD value of double HA/FLAG-tagged aGPCR constructs minus OD value of mock-transfected cells) are given as percentage of the human P2Y12 receptor, which served as positive control (pC). For the cell surface ELISA, the non-specific OD value (pcDps) was 0.03 ± 0.03 (set 0%) and the OD value of P2Y12 was 1.30 ± 0.24 (set 100%). OD readings of 0.08 ± 0.04 (set 0%) and 2.22 ± 0.73 (set 100%) were found in sandwich ELISA (total expression) for the negative control vector (pcDps) and positive control (P2Y12). Data are given as means ± SEM of three independent experiments each performed in triplicates. (G) Studies with peptides derived from the first 11-19 amino acid positions downstream the GPS of GPR126 and GPR133 (Figs. 2 and 3) revealed positions in the N terminal half of the Stachel sequence that are relevant for its functionality. Many of those positions are highly conserved among aGPCRs. Based on current data, one can speculate that N-terminal cleavage at the GPS, extracellular ligand binding and/or ECD-mediated mechanic signals structurally enable the Stachel sequence to function as a peptide agonist for the 7TM. PHENOTYPE:
|