
- Title
-
RA and FGF Signalling Are Required in the Zebrafish Otic Vesicle to Pattern and Maintain Ventral Otic Identities
- Authors
- Maier, E.C., Whitfield, T.T.
- Source
- Full text @ PLoS Genet.

Expression of FGF and RA signalling pathway components during zebrafish OV development. All panels are lateral views with anterior to the left, apart from D,H,L,P,T (dorsal views; anterior left, lateral up), and U (transverse section, lateral left, dorsal up). (A–D) fgf3 is expressed in pharyngeal pouch mesenchyme underlying the anteroventral OV from 18S. At 26 hpf (C,D,V), two stripes of expression underlie the OV in an anteroventral lateral position, and the OV itself expresses fgf3 in the anterior. (E–H) fgf8a expression is very weak at early stages, but is strongly expressed in the anterior OV at 26 hpf (G,H,V). (I–L) At 15S, aldh1a2 is strongly expressed in the mesenchyme posteroventral to the otic placode (I). At later stages, mesenchymal aldh1a2 expression becomes weaker and shifts to a position further away from the OV (J–L,V). (M–P) Expression of aldh1a3 can be detected in the OV from 22S in an anteroventral position. At 26 hpf, the aldh1a3-expressing cells are located in an anteroventral medial position in the OV (O,P,V). (Q–U) Expression of cyp26c1 can be detected in periotic mesenchyme from early stages and at 26 hpf is expressed strongly in the hindbrain (out of focus). Groups of cells expressing cyp26c1 abut the OV anteriorly (R,S, arrows) and ventrolaterally (T, asterisk). (V) Schematic representation of the expression domains of fgf3, fgf8a, aldh1a3, cyp26c1 and aldh1a2 in the OV at 26 hpf in a lateral and dorsal view. Scale bar: 50 µm. EXPRESSION / LABELING:
|
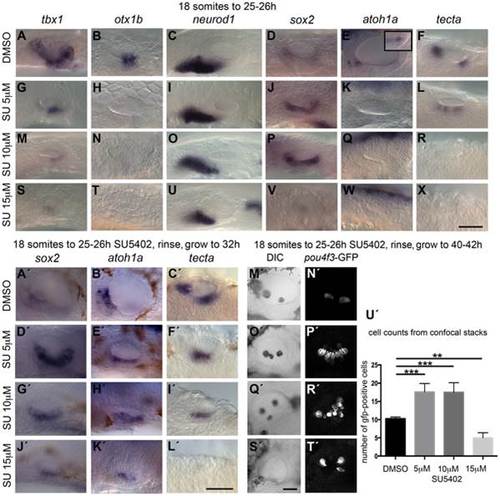
Inhibition of FGF signalling by SU5402 reveals a concentration-dependent effect of FGF signalling during OV development. Wild-type (WT) embryos were treated with DMSO or SU5402 from 18S to 26 hpf (A–X) or rinsed and grown on to 32 hpf (A2–L2) or 40–42 hpf (M2–T2). (A–F) WT embryos treated with DMSO show normal expression of non-neural markers tbx1 (n = 51) and otx1b (n = 61; A,B), the neuronal marker neurod1 (n = 64; C), and the sensory markers sox2 (n = 56), atoh1a (n = 26) and tecta (n = 44; D–F). Boxed area in panel (E) depicts the atoh1a expression in posterior sensory patch in a different focal plane. (G–R) Treatment with 5 µM SU5402 (G–L) or 10 µM SU5402 (M–R) reduces the expression of tbx1 (n = 56; G,I) and neurod1 (n = 76; M,O). Expression of otx1b is lost (n = 32; H,N) and expression of sox2 is extended in the ventral OV floor (n = 45; J,P). The expression of atoh1a is lost (n = 18; K,Q) and expression of tecta is weak but extended (n = 27; L, 5 µM SU5402) or lost (n = 40; R, 10 µM SU5402). (S–X) Treatment with 15 µM SU5402 reduces the expression of tbx1 (n = 38; S) and neurod1 (n = 65; U); expression of otx1b (n = 57), sox2 (n = 58), atoh1a (n = 35), and tecta (n = 51) is lost (T,V–X). (A2–C2) WT embryos treated with DMSO show normal expression of the sensory markers sox2 (n = 23), atoh1a (n = 31) and tecta (n = 25) at 32 hpf. (D2–I2) In embryos treated with 5 µM SU5402 (D2–F2) or 10 µM SU5402 (G2–I2), expression of sox2 (n = 23) and atoh1a (n = 25) is extended in the ventral OV floor; tecta expression is misplaced in a single ventromedial patch (n = 24). (J2–L2) Treatment with 15 µM SU5402 reduces or abolishes the expression of sox2 (n = 18), atoh1a (n = 16), and tecta (n = 14). (M2,N2) Tg(pou4f3:GFP) embryos treated with DMSO show normal hair cell patterns marked with GFP (n = 26). (O2,P2) In Tg(pou4f3:GFP) embryos treated with 5 µM SU5402, GFP-positive cells extended between the anterior and posterior sensory patch in the ventral OV floor (n = 18). (Q2,R2) In Tg(pou4f3:GFP) embryos treated with 10 µM SU5402, GFP-positive cells appear less orderly and are extended in the ventral OV floor (n = 12). (S2,T2) Treatment with 15 µM SU5402 reduced the number of GFP-positive cells in the OV (n = 14). (U2) Graphical representation of counts of GFP-positive cells at 40–42 hpf. Error bars represent standard error of the mean. One-way ANOVA with Dunnett′s multiple comparison post-test: **p = 0.0065, ***p<0.0005. All panels are lateral views with anterior to the left, apart from the panels depicting tecta (dorsal views; anterior to the left, lateral up). Scale bar: 50 µm. |
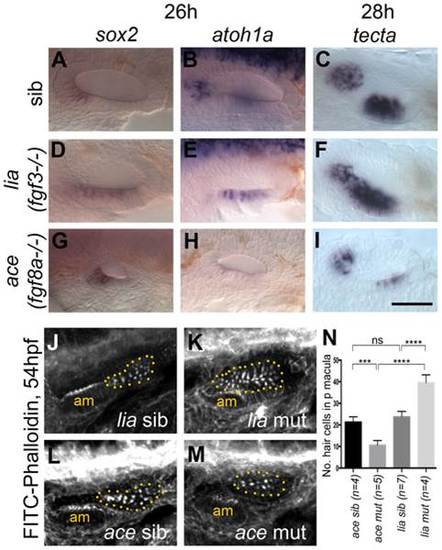
Expression of sensory markers in lia (fgf3-/-) and ace (fgf8a-/-) mutant embryos. (A–C) Phenotypically wild-type sibling (sib) embryos show normal expression of the sensory markers sox2, atoh1a and tecta. (D–F) In lia (fgf3-/-) embryos, expression of sox2 (n = 12/41 embryos from a heterozygous cross), atoh1a (n = 13/45) and tecta (n = 14/42) is extended in the ventral OV floor. (G–I) In ace (fgf8a-/-) embryos, expression of sox2 (n = 12/42), atoh1a (n = 10/39) and tecta (n = 14/54) shows normal spatial patterning, but while sox2 expression levels are slightly increased, atoh1a and tecta levels are reduced. (J–N) Dotted yellow line demarcates the area of the posterior macula in which FITC-Phalloidin-positive hair bundles were counted. (J,L,N) Phenotypically wild-type sibling (sib) embryos show normal numbers of hair cells (n = 7 ears counted, lia sib; n = 4, ace sib). (K) In lia (fgf3-/-) embryos the posterior macula is enlarged; only FITC-phalloidin-positive cells that appeared posterior-like and were located in the demarcated area were counted (n = 4 mutant ears). (M) In ace (fgf8a/) embryos, hair cells show a normal spatial pattern, but the size of the maculae appears reduced (n = 6 mutant ears). (N) Graphical representation of counts of Phalloidin-positive cells at 53–56 hpf in the demarcated area. Error bars represent standard deviation. One-way ANOVA with Šídák′s multiple comparison post-test: ***p<0.001, ****p<0.0001, ns = not significant. All panels are lateral views with anterior to the left, apart from the panels depicting tecta, which are dorsal views with anterior to the left, lateral up. Scale bar: 50 µm. |
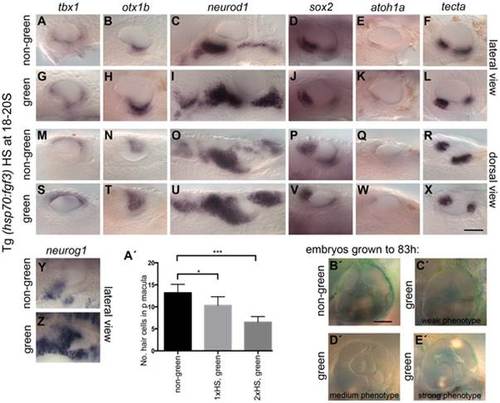
Effects of fgf3 over-expression from the 18 somite stage on otic vesicle patterning. Tg(hsp70:fgf3) embryos were heat shocked (HS) from 18S and sorted as non-green, non-transgenic siblings (A–F, M–R, Y, A′) or green transgenic embryos (G–L, S–X, Z, B′). (A–F, M–R, A′) In non-green embryos, expression of the non-neural markers tbx1 (n = 79; A,M) and otx1b (n = 52; B,N), the neuronal marker neurod1 (n = 18; C,O), and the sensory markers sox2 (n = 11), atoh1a (n = 40), tecta (n = 32) (D–F, P–R) and the neurogenic marker neurog1 (Y, n = 13) is normal. (G–L, S–X, B′) In Tg(hsp70:fgf3) embryos sorted as green, the expression of tbx1 is unaffected or slightly up-regulated (n = 97; G,S), while expression of otx1b (n = 56; H,T), neurog1 (n = 25; Z) and otic and non-otic neurod1 (n = 35; I,U) is strongly up-regulated. The expression of sox2 (n = 24), atoh1a (n = 83) and tecta (n = 100) is slightly reduced and the anterior part of the posterior domain marked by tecta is missing (J–L, V–X). (A′) Graphical representation of counts of GFP-positive sensory hair cells (pou4f3:GFP expression) in the demarcated area from embryos heterozygous for both Tg(hsp70:fgf3) and Tg(pou4f3:GFP). Error bars represent standard deviation. One-way ANOVA with Šídák′s multiple comparison post-test: *p<0.05, ***p<0.001. (B′–E′) Live images of Tg(hsp70:fgf3) embryos HS at 18S and grown to 83 hpf. The inner ear morphology of non-green non-transgenic embryos appears normal (n = 10; B′). (C′–E′) Green Tg(hsp70:fgf3) embryos display only minor ventral patterning defects; the ventral pillar for the lateral semicircular canal is always present (n = 10; C′–E′), but is sometimes displaced posteriorly (E′). Scale bar: 50 µm. EXPRESSION / LABELING:
PHENOTYPE:
|

Heatshock of Tg(hsp70:dnRAR) embryos leads to an expansion of otic otx1b and a loss of neurod1 expression. Tg(hsp70:dnRAR) embryos were heat shocked at 18S and sorted into non-green (non-transgenic siblings), green and very green embryos. (A–F) Non-transgenic sibling embryos show normal pattering of the OV assessed by the exp`ression of the non-neural markers tbx1 and otx1b (A,B), the neuronal marker neurod1 (C), and the sensory markers sox2, atoh1a and tecta (D–F) (at least 50 embryos per marker). (G–R) Embryos with low (G–L) or very low (M–R) levels of RA signalling show only a slight change in tbx1 expression (n = 46; G,M), but expression of otx1b is expanded anteroventrally (n = 109; H,N) and expression of neurod1 is reduced (n = 60; I,O). Expression of sox2 (n = 106), atoh1a (n = 150) and tecta (n = 98) is reduced posteriorly (J–L,P–R) and anteriorly (P–R). All panels are lateral views with anterior to the left, apart from the panels depicting tecta (dorsal views; anterior to the left, lateral up). Scale bar: 50 µm. EXPRESSION / LABELING:
|

aldh1a3 is required to pattern the zebrafish otic vesicle. (A–C) Control uninjected (A, n = 36) and mock-injected (B, n = 14) embryos show normal expression of tbx1. Embryos injected with the aldh1a3 morpholino (C) show an expansion of expression of tbx1 in the anteroventral part of the OV (n = 38/46). (D–F) Control uninjected (D, n = 98) and mock-injected (E, n = 25) embryos show normal expression of otx1b. Embryos injected with the aldh1a3 morpholino (F) show a marked expansion of otx1b expression in the anteroventral part of the OV (n = 95/122). (G–I) Control uninjected (G, n = 11) and mock-injected (H, n = 9) embryos show normal expression of neurog1. Embryos injected with the aldh1a3 morpholino (I) show a marked reduction of neurog1 expression in the OV (n = 33). (J–O) Control uninjected (J,M, n = 42) and mock-injected (K,N, n = 18) embryos show normal expression of neurod1. Embryos injected with the aldh1a3 morpholino (L,O) show a marked reduction of neurod1 expression (n = 70/76). (A–L) Lateral views; (M–O) dorsal views; anterior to the left. Scale bar: 50 µm. EXPRESSION / LABELING:
|
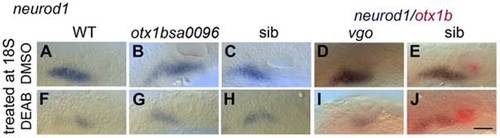
RA signalling is required for normal levels of otic neurod1 expression in the absence of tbx1 and otx1b activity. Embryos were treated with DMSO or DEAB from 18S to 26 hpf. (A) WT embryos treated with DMSO show normal expression of neurod1 (n = 10). (F) Treatment of WT embryos with 400 µM DEAB (n = 18) leads to a reduction in the size of the OV and a reduction neurod1 expression. (B) In otx1bsa96-/- embryos, expression of neurod1 is shifted posteriorly (n = 4/16 embryos from a heterozygous cross). (G) In otx1bsa96-/- embryos treated with DEAB, the OV is smaller and expression of neurod1 is reduced (n = 9/37). (C) In otx1bsa96 sibling (sib; wild-type or heterozygote) embryos, expression of neurod1 is normal (n = 12/16 embryos from a heterozygous cross), but levels are reduced after treatment with DEAB (n = 28/37; H). (D) In tbx1-/- (vgo) embryos, expression of otx1b is lost and expression of neurod1 is shifted posteriorly (n = 9/38). (I) tbx1-/- embryos treated with DEAB (n = 16/62) do not express otx1b (lack of red stain); expression of neurod1 is still shifted posteriorly, but is reduced. (E) vgo sibling embryos treated with DMSO show normal expression of neurod1 (purple) and otx1b (red) (n = 29/38 embryos from a heterozygous cross). (J) Treatment of sibling embryos with DEAB (n = 46/62) leads to a reduction in neurod1 expression. All panels are lateral views with anterior to the left. Dotted outline marks position of the OV; vertical lines mark posterior extent of the neurod1-expressing domain relative to the OV. Scale bar: 50 µm. |
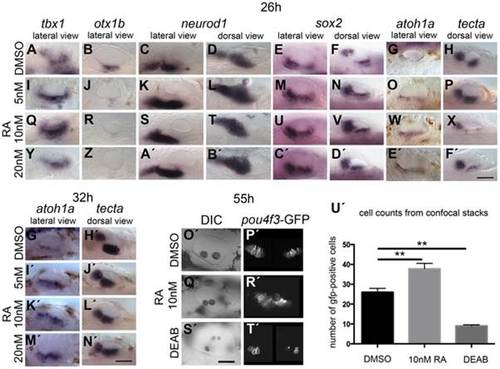
Effects of RA treatment on otic vesicle patterning. WT embryos were treated with DMSO or RA from 20S to 26 hpf (A–F′), 32 hpf (G′–N′) or 55 hpf (O2–T2). (A–H) WT embryos treated with DMSO show normal expression of non-neural markers tbx1 (n = 71; A) and otx1b (n = 52; B), the neuronal marker neurod1 (n = 50; C,D), and the sensory markers sox2 (n = 54), atoh1a (n = 63) and tecta (n = 40) (E–H). (I–X) Treatment with 5 nM RA (I–P) or 10 nM RA (Q–X) results in expanded tbx1 expression (n = 80/110; I,Q), down-regulation of otx1b expression (n = 104; J,R), and expansion of the neurod1 expression domain (n = 94/100). The expression of sox2 (n = 72/86) and atoh1a (n = 68) is extended in the ventral OV floor (M–O, U–W). Expression of tecta (n = 109) is reduced, but tecta-positive cells emerge in the inter-patch space (P,X). (Y–F′) Treatment with 20 nM RA results in a slight down-regulation, but anteroventral expansion, of tbx1 expression (n = 42/62; Y), down-regulation of otx1b expression (n = 64; Z), and an expansion of the neurod1 expression domain (n = 55; A′,B′). Expression of sox2 extends in the ventral OV floor (n = 51/62; C′,D′), while the expression of atoh1a (n = 38/40) is extended. Expression of tecta (n = 44/54) is down-regulated, but tecta-positive cells emerge in the inter-patch space (E′,F). (G′,H′) WT embryos treated with DMSO show normal expression of the sensory markers atoh1a (n = 34) and tecta (n = 49) when grown to 32 hpf. (I′–L′) In embryos treated with 5 nM (I′,J′), 10 nM (K′,L′) or 20 nM RA (M′–N′), expression of atoh1a extends in the ventral OV floor (n = 65, all concentrations). The expression of tecta (n = 96, all concentrations) indicates that the two sensory patches are closer together or fused (J′,L′,N′). (O′–U′) Tg(pou4f3:GFP) embryos treated with DMSO show normal hair cell development in two clearly separated sensory patches (n = 23; O′,P′). In Tg(pou4f3:GFP) embryos treated with 10 nM RA, GFP-positive cells differentiate between the anterior and posterior sensory patch in the ventral OV floor (n = 18; Q′,R′). In Tg(pou4f3:GFP) embryos treated with DEAB, GFP-positive cells are severely reduced in the OV (n = 13; S2,T2). (U′) Graphical representation of the number of GFP-positive cells per ear for each treatment. Error bars represent standard error of the mean. One-way ANOVA with Dunnett′s multiple comparison post-test: RA vs. DMSO: **p = 0.0082; DEAB vs. DMSO: **p = 0.0019. All panels are lateral views with anterior to the left, apart from the panels depicting tecta (dorsal views; anterior to the left). Scale bar: 50 µm. |

RA signalling and FGF signalling are linked in a regulatory feedback loop in the ear. Embryos were treated with DMSO, SU5402 and DEAB from 18S to 26 hpf, with RA from 20S to 26 hpf, and heatshock was performed at the 18/20S stage. (A–H) aldh1a3 expression is normal in sibling embryos (n = 24/31 embryos from a heterozygous cross (ace sib), n = 31/39 (lia sib)) but lost in embryos mutant for fgf8a (ace, n = 7/31; C,D) or fgf3 (lia, n = 8/39; G,H). (I–L) aldh1a3 expression is normal in WT embryos treated with DMSO (n = 15; I,J), but lost in embryos treated with 10 µM SU5402 (n = 35; K,L). (M–P) Tg(hsp70:fgf3) embryos were heat shocked (HS) from 18S and sorted as non-green non-transgenic siblings (M,N), or green transgenic embryos (O,P), and double stained for aldh1a3 (blue) and otx1b (red). In non-green non-transgenic embryos, expression of aldh1a3 is normal (n = 31). In green Tg(hsp70:fgf3) embryos, expression of aldh1a3 and otx1b is up-regulated (n = 48). (Q–S) fgf3 expression is normal in WT embryos treated with DMSO (n = 15; Q) but down-regulated in the otic epithelium in embryos treated with 10 nM RA (n = 28; R); the domain is expanded in embryos treated with DEAB (n = 23; S). (T–V) fgf8a expression is normal in WT embryos treated with DMSO (n = 16; T) but down-regulated in the otic epithelium in embryos treated with 10 nM RA (n = 22; U) and expanded posteroventrally in embryos treated with DEAB (n = 19; V). (W–Y) dusp6 expression is normal in WT embryos treated with DMSO (n = 9; W) but down-regulated in the otic epithelium in embryos treated with 10 nM RA (n = 26; X) and expanded posteroventrally in embryos treated with DEAB (n = 17; Y). (Z–Z3) Tg(hsp70:dnRAR) embryos were heat shocked (HS) from 18S and sorted as non-green non-transgenic siblings (Z) or green transgenic embryos (Z′,Z′′). In non-green, non-transgenic embryos, the expression of fgf3 is normal (n = 18; Z). In green and very green Tg(hsp70:dnRAR) embryos the expression fgf3 is up-regulated (n = 28; Z′,Z′′). Dotted line demarcates the OV. Scale bar: 50 µm. EXPRESSION / LABELING:
|

Elevated levels of FGF3 can counteract the effect of elevated RA signalling on sensory development. Tg(hsp70:fgf3) embryos were treated with DMSO (A,G,M,S) or 20 nM RA from 20S and the first heat shock applied at the same time. Embryos were heat shocked never (A,G,M,S), once (1×HS; C,I,O,U), twice (2×HS; D,J,P,V), three times (3×HS; E,K,Q,W) or four times (4×HS; F,L,R,X) and sorted as non-green non-transgenic siblings (B,H,N,T) or green transgenic embryos (C–X). Non-green non-transgenic siblings were pooled; different HS treatments did not affect the phenotype (B,H,N,T). (A,G,M,S) Tg(hsp70:fgf3) embryos treated with DMSO show normal expression of the sensory marker sox2 (A) and the non-neurogenic marker otx1b (G) and the otic markers neurog1 (M) and neurod1 (S). (B) In non-green sibling embryos treated with 20 nM RA, the expression of sox2 extends across the ventral OV floor. (C–F) In Tg(hsp70:fgf3) embryos treated with 20 nM RA and given 1×HS (C) or 2×HS (D), the expression of sox2 is present in two extended domains at the anterior and posterior of the OV. (E) In Tg(hsp70:fgf3) embryos treated with 20 nM RA and 3×HS the expression of sox2 is normal or slightly reduced. (F) In Tg(hsp70:fgf3) embryos treated with 20 nM RA and 4×HS the expression of sox2 is slightly reduced or normal; the posterior domain of expression is shifted laterally. (H) In non-green sibling embryos treated with 20 nM RA, the expression of otx1b is reduced. (I–L) In Tg(hsp70:fgf3) embryos treated with 20 nM RA and given 1×HS (I), 2×HS (J), 3×HS (K) or 4×HS (L), the expression of otx1b is greatly reduced. (N) In non-green sibling embryos treated with 20 nM RA, the expression of neurog1 is reduced in the OV. (O,P) In Tg(hsp70:fgf3) embryos treated with 20 nM RA and given 1×HS (O) or 2×HS (P), the expression of neurog1 is reduced in the OV. (Q) In Tg(hsp70:fgf3) embryos treated with 20 nM RA and 3×HS the expression of neurog1 is normal but slightly shifted towards posterior. (R) In Tg(hsp70:fgf3) embryos treated with 20 nM RA and 4×HS the expression of neurog1 is increased but shifted to a more posterior position in the floor of the OV. (S,T) In non-green sibling embryos treated with 20 nM RA, the expression of otic neurod1 is slightly increased, while expression is lost in prospective posterior lateral line and vagal ganglion cells posterior to the OV (asterisk). (U–W) In Tg(hsp70:fgf3) embryos treated with 20 nM RA and given 1×HS (U), 2×HS (V) or 3×HS (W) the expression of neurod1 is increased in the OV. In embryos heatshocked three times neuroblasts emerge in a more posterior position in the OV floor (W). (X) In Tg(hsp70:fgf3) embryos treated with 20 nM RA and 4×HS the expression of neurod1 is increased and otic neuroblasts emerge from a more posterior position in the floor of the OV. In addition, neurod1-positive cell populations re-emerge below the OV. All panels are lateral views with anterior to the left. For numbers see Table 1. Scale bar: 50 µm. EXPRESSION / LABELING:
|

Expression of Fgf and RA receptor genes in the zebrafish otic vesicle. (A–L) Expression of FGF receptor genes in the zebrafish OV at 22S and 26 hpf. (A–D) fgfr1a is expressed fairly ubiquitously, including in the OV. (E–H) fgfr2 is expressed in the posterior OV. (I–K) fgfr4 is expressed in the medial OV at 22S. By 26 hpf expression becomes more restricted towards the poles and no expression can be detected in the ventral OV floor. (L) fgfr3 is not expressed in the OV at 26 hpf. Vertical bars in B and F indicate position of section in D and H, respectively. (A,B,E,F,I,J) are dorsal views with anterior to the left. (C,G,K,L) are lateral views with anterior to the left; (D,H) are sections through the ear looking anteriorly. (M–P) Expression of RA receptor genes in the zebrafish OV at 26 hpf. (M) raraa is expressed very weakly in the anteroventral OV. (N) rarab is expressed in two patches in the OV. (O) rarga is expressed in most of the OV, but excluded from the anteroventral region, in a pattern very similar to that of tbx1. (P) rargb is expressed in two patches in the OV. (M,O,P) Lateral views; (N) dorsal view, anterior to the left. Scale bar: 50 µm. EXPRESSION / LABELING:
|

Patterning of the otic vesicle in the aldh1a2-/- (neckless/nls) mutant at 26 hpf. (A–E) Expression of non-neural markers tbx1 (n = 14/19 from a heterozygous cross) and otx1 (n = 39/52), the neuronal marker neurod1 (n = 44/57), and the sensory markers sox2 (n = 45/59) and atoh1a (n = 9/13) are normal in the OV of sibling embryos. (F–J) In aldh1a2-/- (nls) mutants, patterning is relatively normal for all markers tested. Expression of tbx1 (n = 5/19) and otx1 (n = 13/52) is shifted slightly posteriorly, neurod1 (n = 13/57) expression is slightly increased and shifted more posteriorly and expression of sox2 (n = 14/59) and atoh1a (n = 4/13) is normal. All panels are lateral views with anterior to the left. Scale bar: 50 µm. |

SU5402 efficiently down-regulates FGF target genes etv4 and dusp6. Expression of the FGF-responsive genes etv4 (A, n = 12) and dusp6 (E, n = 6) is normal in embryos treated with DMSO from 18S to 26 hpf, but lost in embryos treated with 5 µM (B, n = 10; F, n = 8), 10 µM (C, n = 12; G, n = 10) and 15 µM (D, n = 9; H, n = 12) from 18S to 26 hpf. Inserts show the otic vesicle at higher magnification. All panels are lateral views with anterior to the left. Scale bars: 50 µm. |

Wild-type expression pattern of sox2, atoh1a, tecta, neurod1, tbx1, otx1b, fgf3 and aldh1a3 in the zebrafish otic vesicle at 26 hpf. (A,B,G,H) sox2 (purple) and tecta (red) are co-expressed in the presumptive anterior and posterior maculae. Expression of sox2 (purple) is broader compared with expression of tecta. (C,D,I,J) atoh1a (weak purple) and tecta (red) are co-expressed in the presumptive anterior and posterior maculae. Expression of atoh1a (purple) is more restricted compared with expression of tecta. (E,F,K,L) The neurogenic marker neurod1 (purple) is mainly expressed in neuroblasts of the statoacoustic ganglion beneath the OV; expression of tecta (red) marks the developing sensory maculae in the otic epithelium. (M,N,S,T) The non-neural marker otx1b (purple) and tecta (red) are expressed in distinct domains in the OV. Expression of otx1b can be detected in a ventrolateral domain. (O,P,U,V) fgf3 (purple) and tecta (red) are co-expressed in the anterior OV. (Q,R,W,X) aldh1a3 (purple) is expressed in the anterior OV, partially overlapping with the expression domain of tecta (red) but extending more ventromedially. (Y,B′) aldh1a3 (purple) is expressed in the anterior OV in a position next to the expression domain of neurod1 (red). (Z,A′,C′,D′) tbx1 (purple) is expressed in the ventrolateral OV, posterior to the expression domain of neurod1 (red). (E′) Schematic representation of the expression domains in relation to each other. a: anterior, p: posterior, d: dorsal, v: ventral, l: lateral, m: medial. Scale bar: 50 µm. |

Expression of otx1b and tbx1 in lia (fgf3-/-) and ace (fgf8-/-) mutant embryos. (A, D) Expression of otx1b is normal in lia sibling (n = 65/85 embryos from a heterozygous cross) and ace sibling (n = 64/91) embryos. (B) The expression domain and levels of otx1b are reduced in the lia mutant otic vesicle (n = 20/85). (C) The expression domain of otxb1 is reduced in the much smaller ear of ace mutant (n = 27/91) embryos, but the overall pattern and level are normal. (E, H) Expression of tbx1 is normal in lia sibling (n = 64/87) and ace sibling (n = 59/82) embryos. (F) Expression of tbx1 is expanded anteroventrally in the OV of lia mutant (n = 23/87) embryos, filling in the anteroventral zone that is normally free of tbx1 expression. (G) The pattern of tbx1 expression is almost normal in ace mutant (n = 23/82) embryos, despite the smaller size of the OV. All panels are lateral views with anterior to the left. Scale bar: 50 µm. |

Titration of the RA inhibitor DEAB. Note: this experiment repeats published data [2] where DEAB treatment from 10 hpf to 24 hpf resulted in a complete loss of otic tbx1 expression. (A–F) Embryos were treated from 10 hpf to 24 hpf with DMSO (A) or varying concentrations of DEAB (B–F) and stained for tbx1 at 24 hpf. (A) DMSO-treated embryos display a normal pattern of tbx1 expression (n = 10). (B–D) No change in tbx1 expression is detected in embryos treated with 20 µM (B, n = 62), 50 µM (C, n = 35) or 100 µM (D, n = 11) DEAB. (E) Expression of tbx1 is down-regulated but not completely blocked in embryos treated with 200 µM DEAB (n = 13). (F) tbx1 expression is blocked altogether in embryos treated with 400 µM DEAB (n = 14). (G–K) WT embryos treated with DMSO (G) or DEAB (H–K) at 18/20S, washed at 26 hpf and grown on to 55 hpf. (G) WT embryos treated with DMSO develop normally. (H,I) In WT embryos treated with 200 µM DEAB, ear development is fairly normal (H) or slightly perturbed (I). (J,K) In WT embryos treated with 400 µM DEAB, ear development is severely perturbed in most cases (90%; n = 9/10). The head is also reduced in size and embryos display pericardial oedema. All panels are lateral views with anterior to the left. Scale bar: 50 µm. |

RA-inhibition: mosaic expression of GFP in Tg(hsp70:dnRAR) embryos and phenotype of DEAB-treated embryos at 55 hpf. (A–I) Embryos were heat shocked from 18S and pictures were taken at 26 hpf of embryos from one clutch of Tg(hsp70:dnRAR)♂ × nacre ♀. In all embryos, expression was mosaic in the otic region; representative embryos classified as ‘very green’, ‘green’ and ‘weak green’ are shown. All panels are lateral views with anterior to the left. Scale bar: 250 µm. |

A role for RA in regulating zebrafish otic neurogenesis. Embryos were treated with DMSO, DEAB or RA from 18/20S to 26 hpf. (A–E) The dotted line demarcates the OV. Wild-type embryos treated with DMSO show normal expression of neurog1 (A), while expression is decreased in the OV of wild-type embryos treated with DEAB (B). Otic expression of neurog1 is relatively normal, or slightly reduced, in embryos treated with 5 nM (C), 10 nM RA (D) and 15 nM (E) RA. (F–J) Embryos treated with DMSO show normal expression of neurod1 (F), while expression is decreased in the OV of embryos treated with DEAB (G), and increased in embryos treated with 5 nM (H), 10 nM (I) and 15 nM (J) RA. (K–O) Embryos treated with DMSO show normal otic expression of isl1 (K), while expression is decreased in embryos treated with DEAB (L), and increased in embryos treated with 5 nM (M), 10 nM (N) and 15 nM (O) RA. All panels are lateral views with anterior to the left. Scale bar: 50 µm. |