
- Title
-
The Hypothalamic Leptin-Neurotensin-Hypocretin Neuronal Networks in Zebrafish
- Authors
- Levitas-Djerbi, T., Yelin-Bekerman, L., Lerer-Goldshtein, T., Appelbaum, L.
- Source
- Full text @ J. Comp. Neurol.

The spatial and temporal expression pattern of nts and ntsr throughout zebrafish development. Ventral (A–D) and lateral (E–H) views of a wholemount ISH experiment in larvae, using a probe for nts. A–H: 24 hpf, 2 dpf, 4 dpf, and 6 dpf larvae expressing nts in the PO and H. At 4 and 6 dpf, nts is additionally observed in the PT. I–L: nts mRNA ISH pattern in 100 µm transversal adult brain sections. nts is expressed in the PM, TPp, PTN, Hv, Hd, and Hc of adult zebrafish brains. M–T: Dorsal (M,O), lateral (N,P), and 100 µm transversal adult brain section (Q–T) views of an ISH experiment using an ntsr probe. ntsr is widely expressed throughout the brain, including areas of the telencephalon, diencephalon (TP and hypothalamus), and hindbrain. PO, preoptic region; H, hypothalamus; PM, magnocellular preoptic nucleus; TPp, periventricular nucleus of the posterior tuberculum; PTN, posterior tuberal nucleus; Hv, ventral zone of the periventricular hypothalamus; Hd, dorsal zone of the periventricular hypothalamus, Hc, caudal zone of the periventricular hypothalamus; TC, telencephalic cluster; Pr, pretectum; PT, posterior tuburculum; PG, pineal gland; h, hindbrain; Vs, supracommissural nucleus of V; Ppa, parvocellular preoptic nucleus, anterior part; PGZ, periventricular gray zone of optic tectum; PGN, preglomerular nucleus; LH, lateral hypothalamus; Val, lateral division of valvula cerebelli. |

NTS neurons are primarily GABAergic. Confocal imaging of double fluorescent ISH experiments in larvae and adult zebrafish. A–F: 2 dpf larvae showing colocalization of nts- (magenta) and gad67- (green) expressing cell bodies within the PO (A–C) and hypothalamus (D–F). G–O: Transversal adult brain sections showing colocalization of nts- (magenta) and gad67- (green) expressing cell bodies within the PM (G–I), TPp (J–L), and Hc (M–O). Arrows indicate representative coexpressing cells (white). All images are single confocal sections. PO, preoptic region; H, hypothalamus; PM, magnocellular preoptic nucleus; TPp, periventricular nucleus of the posterior tuberculum; Hc, caudal zone of the periventricular hypothalamus. |
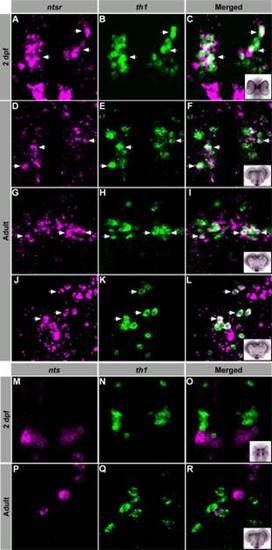
Dopaminergic neurons express NTSR. Confocal imaging of double fluorescent ISH experiments in larvae and adult zebrafish. A–L: 2 dpf larvae and transversal adult brain sections showing colocalization of ntsr- (magenta) and th1- (green) expressing cell bodies within the TP and H (A–C), TPp (D–F), Hd (G–I), and Hc (J–L). M–R: 2 dpf larvae (M–O) and transversal adult brain sections (P–R) showing nts- (magenta) and th1- (green) expressing cell bodies within the hypothalamus. Arrows indicate representative coexpressing cells (white). All images are single confocal sections. TPp, periventricular nucleus of the posterior tuberculum; Hd, dorsal zone of the periventricular hypothalamus; Hc, caudal zone of the periventricular hypothalamus. |
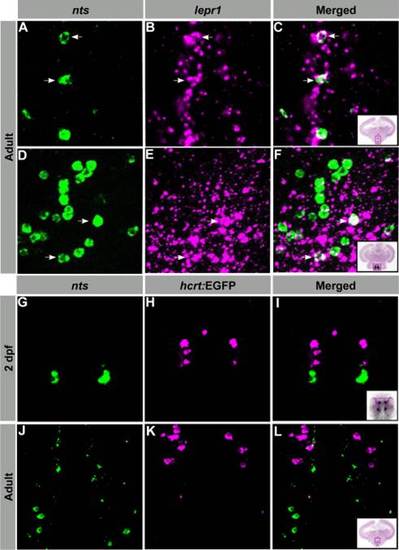
LepR1-expressing NTS neurons are located adjacent to HCRT neurons in the hypothalamus. Confocal imaging of double fluorescent ISH (A–F) and ISH-immunohistochemistry (G–L) experiments in larvae and adult zebrafish. A–F. Transversal adult brain sections showing colocalization of nts- (green) and lepR1- (magenta) expressing cell bodies within the Hv (A–C) and Hc (D–F). G–L: 2 dpf larvae (G–I) and transversal adult brain sections (J–L) showing nts- (green) and hcrt- (magenta) expressing neurons (within the PO and Hv, respectively) that do not colocalize. Arrows indicate representative coexpressing cells (white). All images are single confocal sections. PO, preoptic region; Hv, ventral zone of the periventricular hypothalamus; Hc, caudal zone of the periventricular hypothalamus. |
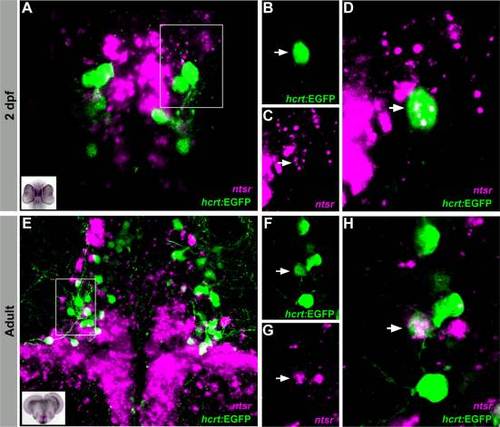
A subpopulation of ntsr-expressing HCRT cells in the hypothalamus. A–D: Z-stack (A) and single plane (B–D) images of coexpressed ntsr (magenta) and HCRT (green) cells in 2 dpf larvae. E–H: Z-stack (E) and single plane (F–H) images of transversal adult brain sections showing colocalization of ntsr- (magenta) and HCRT- (green) expressing cell bodies. Arrows indicate representative coexpressing cells (white). |
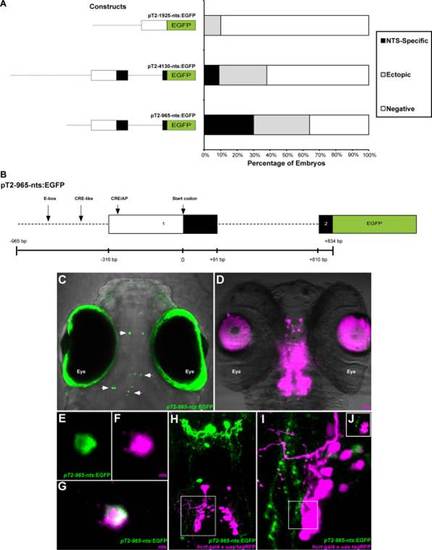
Isolation of a functional nts promoter and live imaging of NTS axon projections. A: Bar graph representing percentages of specific and nonspecific fluorescent expression in 6 dpf larvae injected with pT2–1925-nts:EGFP, pT2–4130-nts:EGFP, or pT2–965-nts:EGFP. B: A schematic illustration of the pT2–965-nts:EGFP construct containing the nts promoter region that includes: 649 bp genomic 52 flanking region, 316 bp 52 UTR, the first exon and intron of the nts gene and 24 bp of the second exon, cloned upstream to EGFP and into a pT2 plasmid. C: At 6 dpf, larvae injected with the pT2–965-nts:EGF P construct displayed mosaic transient expression in NTS neurons. White arrows indicate representative fluorescent cell bodies. D: nts mRNA expression pattern in a 6 dpf larvae. Autofluorescence is shown in the eyes and lens in C,D, respectively. E–G: Colocalization of nts and EGFP in a pT2–965-nts:EGFP injected 6 dpf larvae. H–J: Confocal imaging of 7 dpf hcrt:gal4/uas:tagRFP fish injected with the pT2–965-nts:EGFP construct. NTS-expressing neurons (green) project dorsocaudally in parallel tracts, with branching in the PM and lateral branching extending to HCRT-expressing neurons (magenta) in the Hv. White frame in H is presented at higher magnification in I, and a single plane view of an HCRT cell (magenta) and NTS fiber (green) is shown in J. Hv, ventral zone of the periventricular hypothalamus. |