
- Title
-
Tbx Protein Level Critical for Clock-Mediated Somite Positioning Is Regulated through Interaction between Tbx and Ripply
- Authors
- Wanglar, C., Takahashi, J., Yabe, T., Takada, S.
- Source
- Full text @ PLoS One

Periodic expression of Tbx6 protein and posttranscriptional regulation of its anterior border. (A-C) In situ hybridization with tbx6 probe (A) and immunostaining with anti-Tbx6 antibody (B) were performed using zebrafish embryos at the 8 somite stage (n = 15). Merged image (C) combined (A) and (B) is also shown. Zebrafish tbx6 mRNA is expressed broadly throughout the anterior PSM. At the same time, the Tbx6 protein is also expressed throughout the anterior PSM, however, its anterior border is restricted far posterior to the anterior border of the mRNA. The position of each segmental unit is also indicated from SIII to S-II. (D-F) Quantitative analysis of tbx6 mRNA and protein in the PSM. Intensity of tbx6 mRNA signals in a boxed area in the PSM (D; the boxed area shown in (A) is indicated by 90° rotation) and protein signals in the corresponding area (E; the boxed area shown in (B) is indicated by 90° rotation) was scanned and indicated by green and magenta lines, respectively in (F). While tbx6 mRNA is gradually decreased in the anterior region (shown by dark green line), Tbx6 protein level is abruptly decreased (shown by red line). Anterior is left and posterior is right. (G-I) Indication of 3 typical patterns of embryos stained with anti-Tbx6 antibody. Embryos were observed at 8 somite stage. Comparative analysis with her1 mRNA expression shown in Figure 2 indicates that the anterior border of the Tbx6 protein follows a phase of periodic change. After a long core domain of Tbx6 proteins is generated (G), an anterior part of the Tbx6 protein domain was eliminated, resulting in appearance of the upper band, which is indicated by an arrowhead (H), then this upper band disappeared, resulting in a short Tbx6 domain (I). Out of a total of 154 embryos examined, around 40% of them showed (G), 35% showed (H), 25% showed (I) type of expression pattern. (J) A 10 somite stage embryo injected with both her1 and her7 specific antisense morpholino oligos was stained with anti-Tbx6 antibody. The defects were observed in 97.5% of the injected embryos (n = 40). (K) A 10 somite stage embryo treated with DAPT, a Notch inhibitor, was stained with anti-Tbx6 antibody. The defects were observed in all of the embryos treated with DAPT (n = 22). Pattern of Tbx6 proteins was disturbed in anterior area indicated by a bracket (J, K). The yellow dotted lines indicate S-II (G, H) and S-II and S-III (I) regions. EXPRESSION / LABELING:
|

Spatial pattern of the Tbx6 protein (A′-C&prime& magenta) is compared with those of her1 mRNA (A-C; green) at 3 different phases of segmentation cycle at around the 8 somite stage. Merged images are also indicated (A′′-C′′). According to the general nomenclature [39], the phases shown in A, B, and C appear to correspond to the phase III, I, and II, respectively. (B-B′′) Anterior Tbx6 starts to disappear with some remains (the upper band: arrowhead) (B′). (C-C′′) The upper band of Tbx6 disappears and the next Tbx6 anterior border shifts posteriorly. (A-A′′) The core domain was extended posteriorly. Out of a total of 42 embryos examined, around 35% of them showed A type, 41% showed B type, 24% showed C type of expression. The dotted lines indicate S-II (A′′, B′′) and S-II, S-III (C′′) regions. EXPRESSION / LABELING:
|

Comparative analysis of the anterior border of the Tbx6 domain with expression of mesp and ripply. Spatial pattern of the Tbx6 protein (magenta) is compared with those (green) of mesp-ab mRNA (A-D) and ripply1 mRNA (E-G) at 3 different phases of segmentation cycle (the phases in embryos shown in A, B, or C are identical to those shown in E, F, or G, respectively) at around the 8 somite stage. Tbx6 pattern was also compared with mesp-ab mRNA in embryos treated with DAPT (D). Merged images are indicated (A′′-G′′). Out of a total of 59 embryos examined, around 46.5% of them showed A and E phase, 27% showed B and F phase, 26.5% showed C and G phase type of expression. Note that the anterior limit of newly expressed, or most posterior, mesp-ab band coincided with the anterior border of the Tbx6 core domain (A-A′′). Then, this expression coincided with the upper band of Tbx6 when elimination of the anterior Tbx6 domain started (B-B′′). On the other hand, new ripply1 expression emerged within the anterior part of Tbx6 domain (E-E′′) and the Tbx6 domain starts to vanish in area where ripply1 was expressed (F-F′′). In (D), the defects were observed in all of the embryos treated with DAPT (n = 22). Patterns of Tbx6 proteins and mesp-ab mRNA were disturbed in anterior area indicated by a bracket. The dotted lines indicate S-II (A′′, B′′, E′′, F′′) and, S-II and S-III (C′′, G′′) regions. EXPRESSION / LABELING:
|
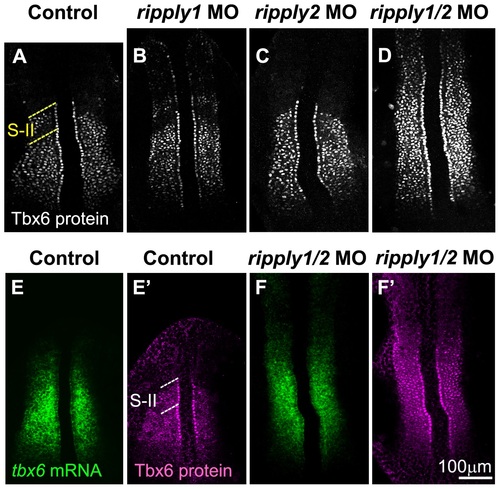
Proper positioning of Tbx6 domain depends on ripply. (A-D) Patterns of Tbx6 protein at the 8 somite stage in control (n = 20) (A), ripply1 morphant (n = 25) (B), ripply2 morphant (n = 20) (C) and ripply1/ripply2 double morphant (n = 30) (D). Comparison of Tbx6 protein (E′, F′) with its mRNA (E, F) patterns in control (E, E′) and ripply1/ripply2 double morphant (F, F′). ripply1 morphants show graded expansion of Tbx6 protein anteriorly (B) but ripply2 morphants (C) show no significant difference from control embryos (A). Double knockdown of ripply1 and ripply2 show strong expansion of Tbx6 protein anteriorly (D). In the double morphants, tbx6 mRNA is also anteriorly expanded to some level, but not so significantly as Tbx6 protein (F, F′). A total of 20 injected embryos were observed for each injection. While ripply2 morphant appeared similar to control embryos in Tbx6 protein pattern, 100% of the ripply1 morphants and 100% of the ripply1 and ripply2 double morphants displayed anterior expansion of Tbx6 protein shown in (B) and (D) respectively. The dotted lines indicate S-II (A, E′) region. EXPRESSION / LABELING:
|
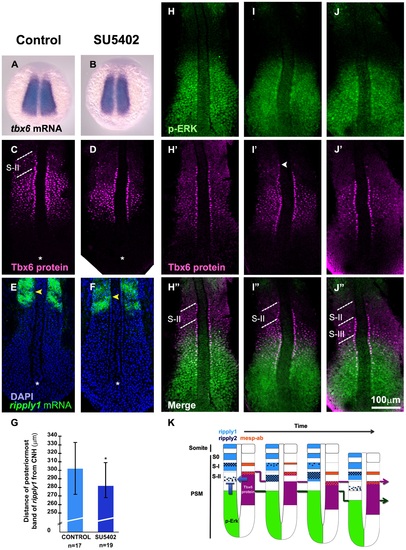
FGF signaling is required for ripply suppression. (A-F) Effect of SU5402, a chemical inhibitor against FGF signaling, on tbx6 mRNA (A, B), Tbx6 protein (C, D) and ripply1 mRNA (E, F) patterns in embryos at the 8 somite stage. Control embryos treated with DMSO (A, C, E) and embryos treated with SU5402 (B, D, F) are shown. While tbx6 mRNA expression was unchanged (A, B), the anterior border of the Tbx6 domain was moved posteriorly in SU5402 treated embryos when compared with control embryos at the same phase of the segmentation cycle (C, D). Note that both of these embryos are at the stage when Tbx6 proteins just started to be eliminated in the anterior domain. A total of 15 number set of embryos were observed each for A and B, and all of the treated embryos did not show any change in tbx6 mRNA expression pattern when compared to control embryos. Another 32 number set of embryos were treated with SU5402 and examined for Tbx6 protein, where, about 87% of the embryos showed posterior shift of anterior domain of Tbx6 protein when compared to control embryos. (E, F) ripply1 expression is initiated earlier (yellow arrowheads) in SU5402 treated embryos (F) when compared to control ones (E) at the same phase of the segmentation cycle. Asterisk indicates the position of the chordo neural hinge (CNH). (G) The distance of the anterior border of the posteriormost expression of ripply1 from the CNH in SU5402 treated embryos was significantly shorter than the control embryos; * p<0.05 (n = 17 for control embryos and n = 19 for SU5402 treated embryos). Error bars indicate standard deviation. (H-J) Spatial distribution of FGF signaling was examined during a segmentation cycle in comparison with Tbx6 protein domain at the 8 somite stage. FGF signaling was monitored by staining with anti-phosphorylated Erk antibody. The upper band is indicated by an arrowhead in white. (K) A schematic representation of spatial patterns of Tbx6 and p-Erk domains with ripply1, ripply2, and mesp-ab expressions during single segmentation cycle. Expression of ripply1 and ripply2 is initially activated in the high Tbx6/low FGF signaling region. These activated Ripplys appear to suppress Tbx6 protein resulting in formation of a new anterior border of the Tbx6 core domain and the upper band. Then, expansion of ripply expression domain causes elimination of the upper band of Tbx6 protein. On the other hand, mesp-ab expression is activated at the anterior border of the Tbx6 domain, and remained at the same position. The dotted lines indicate S-II (C, H′′, I′′) and, S-II and S-III (J′′) regions. EXPRESSION / LABELING:
|

Expression of mesp-ba and Tbx6 at the prospective segmentation boundary. Expression of mesp-ba in relation to the Tbx6 protein expression during different phases of somite segmentation. (A-A′′) At the phase where the Tbx6 protein is expressed as a long core domain, the mesp-ba expresses as the three band pattern with the posteriormost band coinciding with the anterior border of Tbx6 at S-II. (B-B′′) When the anterior region of Tbx6 starts to disappear, the posteriormost mesp-ba overlapped with the Tbx6 upper band, while the anteriormost band slowly disappears. (C-C′′) The upper band of Tbx6 disappears but the core domain was shorter than in (A). At this phase, the mesp-ba expressed at the Tbx6 border does not yet emerge. Arrowhead (white) indicates the upper band. The S-II and S-III regions are shown by dotted lines. EXPRESSION / LABELING:
|

Expression of zebrafish ripply2 and Tbx6 protein. (A-A′′) The expression of ripply2 mRNA was initiated at the anterior region of the Tbx6 domain when the core domain was longer (B-B′′). Accordingly to the increase in ripply2 expression, Tbx6 proteins were eliminated in ripply2 positive area, resulting in gap between the upper band and the core domain of the Tbx6 expression. (C-C′′) Finally, when the Tbx6 anterior region was completely eliminated, ripply2 was strongly expressed in S-II region. The S-II and S-III regions are marked by dotted lines. The phases shown in A, B and C are consistent with those in Fig.3. White arrowhead indicates the upper band of Tbx6 protein. EXPRESSION / LABELING:
|