- Title
-
The Hemodynamically-Regulated Vascular Microenvironment Promotes Migration of the Steroidogenic Tissue during Its Interaction with Chromaffin Cells in the Zebrafish Embryo
- Authors
- Chou, C.W., Zhuo, Y.L., Jiang, Z.Y., Liu, Y.W.
- Source
- Full text @ PLoS One
|
Morphology of pronephros and interrenal tissue in the absence of blood flow. (A) The interrenal steroidogenic tissue positive for 3β-Hsd activity forms an extension that protrudes toward the midline by 54 hpf (cell protrusions marked by red arrows), while kidney glomeruli delineated by wt1b: GFP expression (G, yellow arrowheads) assemble at the midline. Morphogenetic movements of kidney glomeruli and steroidogenic tissues are defective in the tnnt2a morphant. All panels show dorsal views of representative embryos. (B) Quantification of effects of tnnt2aMO injection on interrenal migration. The distance between the midline and the migrating tip of steroidogenic tissue was designated as positive if the migrating tip had not reached the midline, and negative if the tip had migrated across the midline. (C) Relative density of steroidogenic tissue, as assessed by 3β-Hsd activity staining in the ventral surface, in tnnt2a morphants compared to wild-type controls. The number of embryos in each group is indicated in parentheses in (B) and (C). Histograms with different letters above them are significantly different (ANOVA and Duncan′s multiple test, P<0.05). (D) Effect of camptothecin treatment from 48 to 57 hpf on 3β-Hsd activity in steroidogenic cells. A, anterior; P, posterior; L, left; R, right. Broken yellow lines indicate position of the midline. Abbreviations: glomerulus (G). Scale bar, 50 µm. EXPRESSION / LABELING:
PHENOTYPE:
|
|
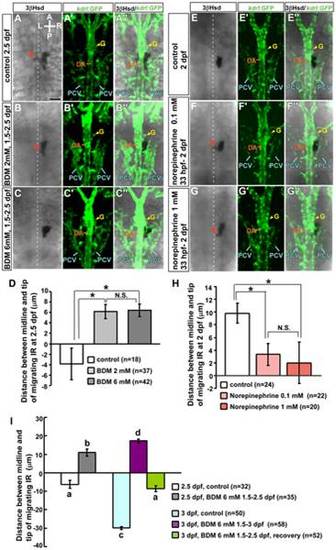
Effects of 2,3-BDM and norepinephrine on morphogenetic movements of interrenal tissue. For repression of blood flow, Tg(kdrl: GFP)s843 embryos were treated with (A–A′′) vehicle (control), or 2,3-BDM at a concentration of (B–B′′) 2 mM or (C–C′′) 6 mM from 1.5 dpf. A suppression of the medial extension of steroidogenic cells was observed in 2,3-BDM-treated embryos at 2.5 dpf, while the morphology of the DA and the pronephric glomerulus (yellow arrowheads) appeared unperturbed. Protrusions (red arrow) formed at the lower concentration; the phenotype was more severe at the higher concentration. For acceleration of blood flow, Tg(kdrl: GFP)s843 embryos were treated with (E-E′′) vehicle (control), or norepinephrine at a concentration of (F–F′′) 0.1 mM or (G-G′′) 1 mM from 33 hpf. An enhancement of interrenal medial extension, as evidenced by the formation of protrusions, was observed in norepinephrine-treated embryos at 2 dpf. The effects of 2,3-BDM and norepinephrine treatments on interrenal migration were quantified in (D) and (H), respectively. The distance between the midline and migrating tip of steroidogenic tissue was designated as positive if the migrating tip had not reached the midline, and negative if the tip had migrated across the midline. *P<0.05; N.S., not significant (Student′s t-test). (I) Suppressing effect of interrenal cell migration by 2,3-BDM at 6 mM from 1.5 dpf was reversible at 3 dpf, as the 2,3-BDM applied from 1.5 dpf was washed out at 2.5 dpf for restoring blood flow. The interrenal tissue in recovered embryos extended across the midline at 3 dpf and displayed a migration distance not significantly different from that in control embryos at 2.5 dpf. Histograms with different letters above them are significantly different (ANOVA and Duncan′s multiple test, P<0.05). A, anterior; P, posterior; L, left; R, right. Broken white lines indicate position of the midline. Abbreviations: glomerulus (G), posterior cardinal vein (PCV). Scale bar, 50 µm. |
|
Effects of 2,3-BDM and norepinephrine on IRV formation. For repression of blood flow, Tg(kdrl: GFP)s843 embryos were treated with (A–A′) vehicle (control), or 2,3-BDM at a concentration of (B–B′) 2 mM or (C–C′) 6 mM from 1.5 dpf, and harvested at 2.5 dpf. For acceleration of blood flow, Tg(kdrl: GFP)s843 embryos were treated with (E-E′) vehicle (control), or norepinephrine at a concentration of (F–F′) 0.1 mM or (G-G′) 1 mM from 33 hpf, and harvested at 2 dpf. Transverse sections of harvested embryos were subject to analysis of 3β-Hsd activity (black) and GFP expression (green). IRV lengths of 2,3-BDM- or norepinephrine-treated embryos were quantified in (D) and (H), respectively; which were verified from confocal Z-stacks covering the full range of IRV growth, and measurements were made from single focal planes displaying the maximal range of ventrally extending IRV. *P<0.05, ***P<0.0005, N.S., not significant (Student′s t-test). (I) Repressing effect of 2,3-BDM (6 mM) on IRV growth was reversible at 3 dpf, as the 2,3-BDM applied from 1.5 dpf was washed out at 2.5 dpf. The IRV length in recovered embryos at 3 dpf was not significantly different from that in control embryos at 2.5 dpf. Histograms with different letters above them are significantly different (ANOVA and Duncan′s multiple test, P<0.05). D, dorsal; V, ventral; L, left; R, right. Abbreviations: interrenal tissue (IR), notochord (NC), somite (S). Scale bar, 25 µm. |
|
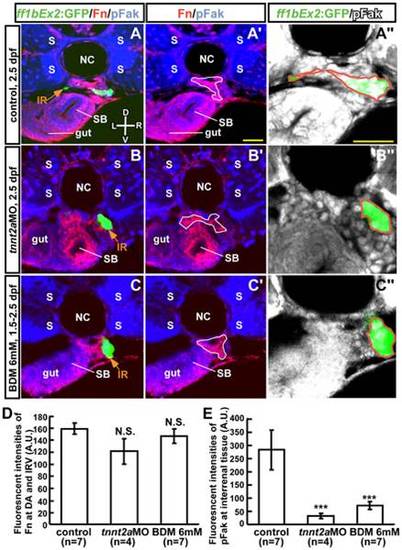
Effect of blood flow inhibition on the ECM microenvironment and pFak distribution in interrenal steroidogenic tissue. Transverse sections of Tg(ff1bEx2: GFP) embryos were (A–A′′) uninjected (control), (B–B′′) injected with tnnt2aMO, or (C–C′′) treated with 6 mM 2,3-BDM from 1.5 dpf. Embryos were harvested at 2.5 dpf and assayed for expression of GFP (green), Fn (red), and pFak (blue in A–C and A′–C′; white in A′′–C′′). Images are single confocal planes showing the maximal transverse dimension of ff1bGFP-expressing steroidogenic tissue of a representative embryo, with magnified views shown in (A′′–C′′). (D) Fluorescence intensity of Fn in the DA and IRV selected as regions of interest (ROI; white lines in A′–C′) normalized to the size of the ROI. (E) Total fluorescence intensities of pFak within the steroidogenic tissue (ROI marked by orange lines in A′′–C′′) were normalized to the size of the cluster. The difference between the treatment and the control groups was analyzed by Student′s t-test. ***P<0.001, N.S., not significant. D, dorsal; V, ventral; L, left; R, right. Abbreviations: arbitrary units (A.U.), interrenal tissue (IR), notochord (NC), somite (S), swim bladder (SB). Scale bar, 25 µm. EXPRESSION / LABELING:
|
|
Suppression of interrenal tissue migration in klf2a and mmp2 morphants. Dorsal view of interrenal steroidogenic tissue (IR, red arrows) as detected by 3β-Hsd activity staining, with adjacent vasculature marked by GFP expression. Tg(kdrl: GFP)s843 embryos were (A, A′) uninjected (control), or injected with (B, B′) klf2aMO or (C, C′) mmp2MO. (D) Quantification of the effects of MO-mediated gene knockdown on interrenal migration. The distance between the midline and the migrating tip of steroidogenic tissue was designated as positive if the migrating tip had not reached the midline and negative if it had crossed the midline. The number of embryos in each group is indicated in parentheses. The extent of interrenal medial extension of control 2.5-dpf embryos in panel 5D was not statistically different from those in Figure 2D and 2I. Fn and pFak expression in the interrenal region was examined in (E–E′′′′) uninjected (control), and (F–F′′′′) klf2aMO- and (G–G′′′′) mmp2MO-injected embryos by IHC. Images show transverse sections of a representative embryo from each treatment group. (H) Quantification of the effects of klf2aMO and mmp2MO on IRV growth, Fn level in the vicinity of the DA and IRV (ROI marked by broken lines in E′′–G′′), and pFak level in the steroidogenic tissue (ROI marked by orange lines in E′′′′–G′′′′). The number of embryos in each group is indicated in parentheses. Fluorescence intensities of Fn and pFak were normalized to their respective ROI sizes. The difference between the treatment and the control groups was analyzed by Student′s t-test. *P<0.05, ***P<0.001, N.S., not significant. A, anterior; P, posterior; L, left; R, right; D, dorsal; V, ventral. Abbreviations: notochord (NC). Scale bar, 25 µm. |
|
Steroidogenic cells are induced to undergo an EMT-like change by hemodynamic forces and pFak signaling. (A–E) Ventral view of the midtrunk from 34 to 84 hpf; steroidogenic cells become loosely associated and develop protrusions at the cell surface. The accumulation of β-Catenin at cell-cell junctions in the steroidogenic tissue can be seen in cross sections of Tg(ff1bEx2: GFP) embryos at (F, F′) 2 dpf, but not at (G, G′) 2.5 dpf. The decrease in junctional β-Catenin was not observed in (H, H′) tnnt2a morphants, (I, I′) 2,3-BDM- or (J, J′) RGD-treated embryos, or (K, K′) klf2a or (L, L′) mmp2 morphants. Sections are shown of a representative embryo from each treatment group. (M) Fluorescence intensity of β-Catenin in ff1bGFP-expressing steroidogenic tissue (ROI marked by orange lines) is normalized to the size of the cluster, with the number of embryos indicated in parentheses. The difference between 2-dpf control group and any of the other groups was analyzed by Student′s t-test. *P<0.05, N.S., not significant. A, anterior; P, posterior; L, left; R, right; D, dorsal; V, ventral. Broken yellow lines indicate position of the midline. Abbreviations: notochord (NC). Scale bar, 25 µm. |
|
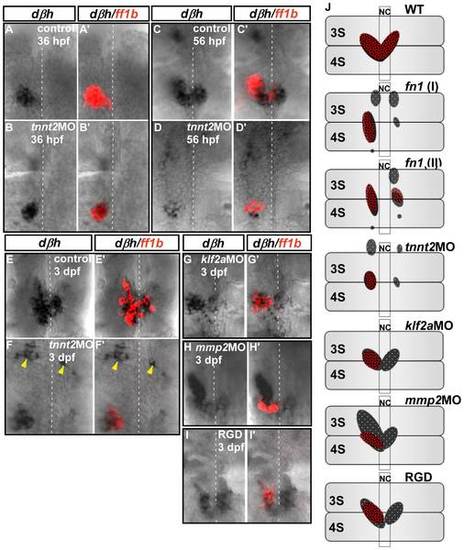
Interaction between interrenal steroidogenic and chromaffin cells in tnnt2a, klf2a, and mmp2 morphants and RGD-treated embryos during interrenal gland assembly. Double ISH assays showing colocalization of ff1b (red) and dbh (black) transcripts in uninjected control embryos and tnnt2a morphants at (A, A&prime& B, B′) 36 hpf (n = 3 and 6, respectively), (C, C&prime& D, D′) 56 hpf (n = 3 and 5, respectively), and (E, E&prime& F, F′) 3 dpf (n = 17 and 15, respectively), and in (G, G′) klf2a (n = 9) and (H, H′) mmp2 (n = 8) morphants and (I, I′) RGD-treated embryos (n = 18) at 3 dpf. Ventral flat mount views are shown for representative embryos in each group, oriented with anterior at the top. Yellow arrowheads indicate chromaffin cell clusters that failed to converge at the interrenal area in tnnt2a morphants. Broken white lines indicate position of the midline. (J) Schematic representation of various phenotypic defects associated with interrenal organ assembly. Panels show ventral views of wild-type, mutant, morphant, and drug-treated embryos at 3 dpf, oriented with anterior at the top. Phenotypes depicted for cloche (clo) and fn1 mutants are based on previous reports [9], [21]. Abbreviations: notochord (NC), the third somite (3S), the fourth somite (4S). EXPRESSION / LABELING:
PHENOTYPE:
|
|
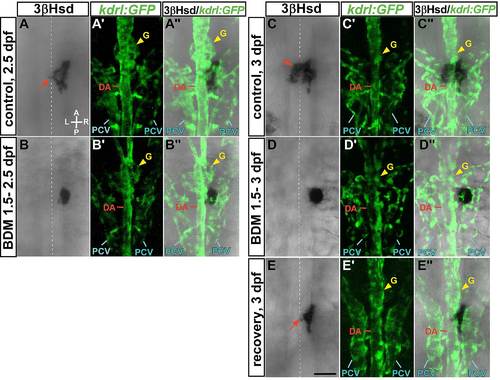
Interrenal cell migration suppressed by 2,3-BDM was recovered following the removal of 2,3-BDM. The interrenl tissue stained by 3β-Hsd activity assay in the control Tg(kdrl: GFP)s843 embryo continued to extend across the midline from 2.5 dpf (A-A′′) to 3 dpf (C-C′′), while migration of interrenal cells was repressed by 2,3-BDM treatment at 6 mM from 1.5 to 2.5 dpf (B-B′′) or 3 dpf (D-D′′). Migration of interrenal cells was recovered at 3 dpf as 2,3-BDM was washed out at 2.5 dpf (E-E′′). Protrusions of extending interrenal tissues (red arrows) were detected in control as well as recovered embryos. Broken white lines indicate position of the midline. Abbreviations: glomerulus (G), posterior cardinal vein (PCV). Scale bar, 50 µm. |
|
Effects of blood flow inhibition on IRV growth was reversible following the removal of 2,3-BDM. The IRV in the control Tg(kdrl: GFP)s843 embryo continued to extend from 2.5 dpf (A, A′) to 3 dpf (C, C′), while the IRV growth was repressed by 2,3-BDM treatment at 6 mM from 1.5 to 2.5 dpf (B, B′) or 3 dpf (D, D′). Extension of IRV was recovered at 3 dpf as 2,3-BDM was washed out at 2.5 dpf (E, E′). The interrenal tissue (IR) was detected by 3β-Hsd acitivity assay. D, dorsal; V, ventral; L, left; R, right. Broken yellow lines indicate position of the midline. Abbreviations: notochord (NC), somite (S). Scale bar, 50 µm. |
|
Effect of l-NAME on morphogenetic movements of interrenal steroidogenic tissue and IRV formation. (A–A′′) Tg(kdrl: GFP)s843 embryos treated with 100 µM l-NAME from 1.5 dpf onwards had interrenal steroidogenic tissue (IR) morphology (orange arrows) and (B–B′′) IRV length similar to control embryos (Figure 3A, A′, D) at 2.5 dpf (n = 8). The activity of endothelial NO synthase was inhibited by l-NAME at concentrations higher than 10 µM [50]. D, dorsal; V, ventral; L, left; R, right. Abbreviations: posterior cardinal vein (PCV). Scale bar, 50 µm. |
|
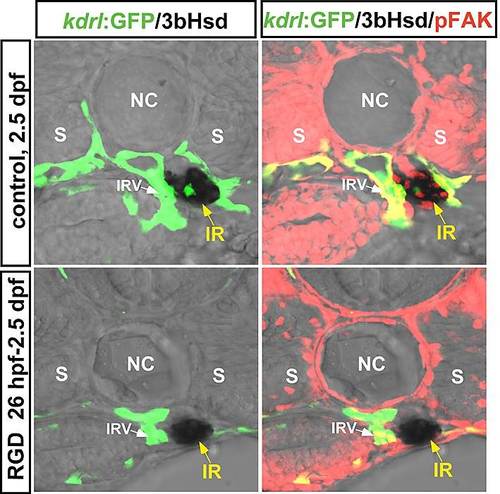
Effect of RGD treatment on pFAK distribution in the interrenal region. Transverse sections of Tg(kdrl: GFP)s843 embryos either untreated (control; n = 6) or treated with 100 µM RGD peptide (n = 10) from 26 hpf and harvested at 2.5 dpf for evaluation of 3β-Hsd activity and pFak level by IHC. Sections are shown of a representative embryo from each group, oriented with the dorsal side at the top. Abbreviations: interrenal tissue (IR), notochord (NC), somite (S). |
|
Steroidogenic cells display a decrease of E-cadherin expression which is induced by hemodynamic forces and pFak signaling. E-cadherin in the fluorescent steroidogenic tissue of Tg(ff1bEx2: GFP) embryos was decreased from 2 dpf (A-A′) to 2.5 dpf (B-B′). The decrease in E-cadherin was not observed in (C, C′) tnnt2a morphants, (D, D′) RGD-treated embryos, or (E, E′) klf2a or (F, F′) mmp2 morphants. Sections are shown of a representative embryo from each treatment group. (F) Fluorescence intensity of E-cadherin in ff1bGFP-expressing steroidogenic tissue is normalized to the size of the cluster, with the number of embryos indicated in parentheses. The difference between 2-dpf control group and any of the other groups was analyzed by Student′s t-test. *P<0.05, **P<0.005, N.S., not significant. D, dorsal; V, ventral; L, left; R, right. Abbreviations: notochord (NC). Scale bar, 25 µm. |
|
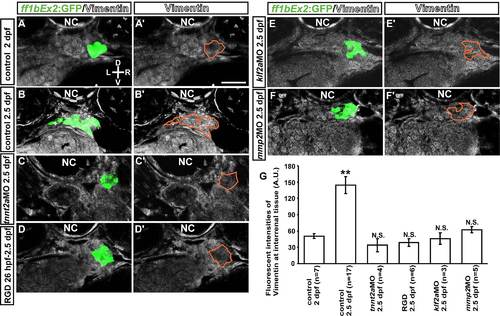
Steroidogenic cells display a rise of Vimentin expression which is induced by hemodynamic forces and pFak signaling. Vimentin in the steroidogenic tissue (marked by green fluorescence) of Tg(ff1bEx2: GFP) embryos was increased from 2 dpf (A-A′) to 2.5 dpf (B-B′). The increase in Vimentin was not observed in (C, C′) tnnt2a morphants, (D, D′) RGD-treated embryos, or (E, E′) klf2a or (F, F′) mmp2 morphants. Sections are shown of a representative embryo from each treatment group. (G) Fluorescence intensity of Vimentin in ff1bGFP-expressing steroidogenic tissue (ROI marked by orange lines) is normalized to the size of the cluster, with the number of embryos indicated in parentheses. The difference between 2-dpf control group and any of the other groups was analyzed by Student′s t-test. **P<0.005, N.S., not significant. D, dorsal; V, ventral; L, left; R, right. Abbreviations: notochord (NC). Scale bar, 25 µm. |


