
- Title
-
Translational profiling through biotinylation of tagged ribosomes in zebrafish
- Authors
- Housley, M.P., Reischauer, S., Dieu, M., Raes, M., Stainier, D.Y., Vanhollebeke, B.
- Source
- Full text @ Development
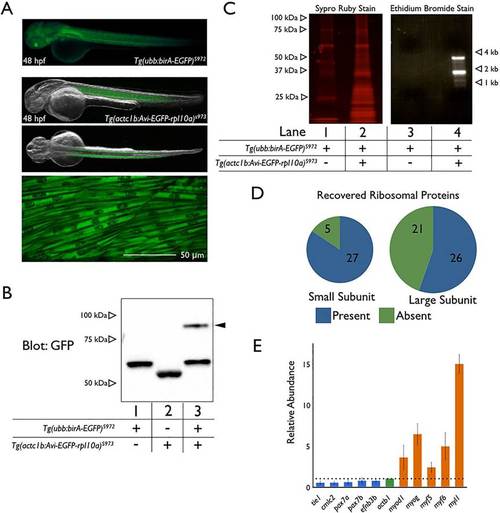
Skeletal muscle-specific translating ribosome purification in zebrafish embryos. (A) Fluorescence image of Tg(ubb:birA-EGFP) expression (upper panel) at 48hpf. Merged fluorescence and bright-field images of Tg(actc1b:Avi-EGFP-rpl10a) expression at 48hpf in the middle two panels show lateral and dorsal views. The bottom panel is a confocal image of Tg(actc1b:Avi-EGFP-rpl10a) expression in skeletal muscle. Anterior is towards the left; dorsal towards the top. (B) Streptavidin shift assay with lysates from 15 embryos from Tg(ubb:birA-EGFP)s972 crossed with wild type (lane 1), from Tg(actc1b:Avi-EGFP-rpl10a)s973 crossed with wild type (lane 2), or from Tg(ubb:birA-EGFP)s972 crossed with Tg(actc1b:Avi-EGFP-rpl10a)s973 (lane 3). Arrowhead indicates Avi-EGFP-Rpl10a bound with free streptavidin. Protein from four larvae at 4dpf was applied to each lane. (C) Eluates from the skeletal muscle TRAP performed on 200 embryos (36hpf) from Tg(ubb:birA-EGFP)s972 crossed with Tg(actc1b:Avi-EGFP-rpl10a)s973. Eluates were separated by SDS-PAGE and stained with Sypro Ruby protein stain (lane 1 is from sibling controls, whereas lane 2 is from embryos expressing both transgenes). Lanes 3 (sibling controls) and 4 (TRAP embryos) depict an ethidium bromide stained agarose gel following Trizol extraction. (D) Illustration of ribosomal proteins with at least one peptide recovered by mass spectrometry analysis of skeletal muscle TRAP eluates. The full list is provided in supplementary material Table S1. (E) qPCR of skeletal muscle and non-skeletal muscle genes from reverse transcribed mRNA purified by TRAP or from whole lysate (input) from 48hpf embryos generated by crossing Tg(ubb:birA-EGFP)s972 to Tg(actc1b:Avi-EGFP-rpl10a)s973. The data are shown as relative abundance of purified mRNA divided by total input mRNA (i.e. TRAP/input) normalized to act1b. Error bars represent s.e.m. from three independent experiments. EXPRESSION / LABELING:
|
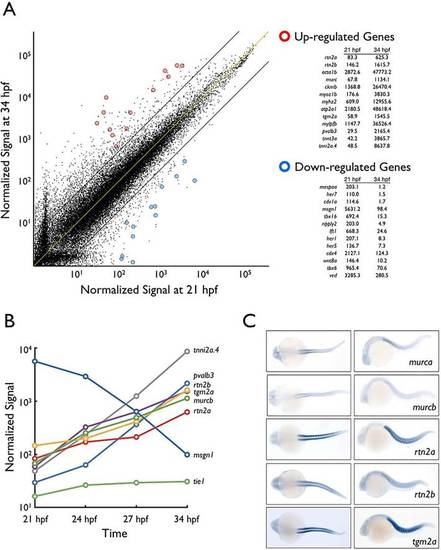
Translational profiling of zebrafish skeletal muscle. (A) Expression profile of 21hpf versus 34hpf skeletal muscle-specific TRAP mRNA assayed by microarray hybridization. Dots represent normalized hybridization signals of individual genes plotted on a log scale. Blue circles indicate downregulation over time whereas red circles indicate upregulation. The yellow line represents no difference in expression between samples whereas the black lines depict a fivefold change. (B) Timecourse of relative expression (log scale, y-axis) of selected genes from A. tie1 is an endothelial-specific gene and is minimally expressed. mesogenin (msgn1) is an example of a gene whose expression is downregulated during skeletal muscle development. (C) Whole-mount in situ hybridization at 28hpf of selected upregulated mRNAs. Dorsal (left) and lateral (right) views. EXPRESSION / LABELING:
|
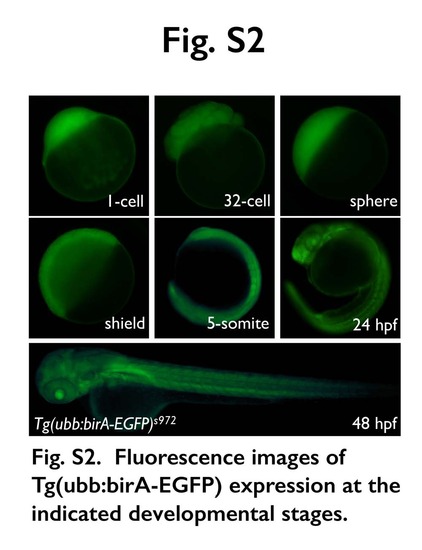
Fluorescence images of Tg(ubb:birA-EGFP) expression at the indicated developmental stages. |