
- Title
-
Transient infection of the zebrafish notochord with E. coli induces chronic inflammation
- Authors
- Nguyen-Chi, M., Phan, Q.T., Gonzalez, C., Dubremetz, J.F., Levraud, J.P., Lutfalla, G.
- Source
- Full text @ Dis. Model. Mech.

Injection of Escherichia coli into the notochord of zebrafish larvae. (A) Embryos at 48 hpf. Bacteria were injected (elongated arrowhead) into the notochord (red) dorsal to the urogenital opening. The dashed line with arrowheads shows the region where cross-sections have been performed for electron microscopy. (B,C) Transmission electron microscopy analysis of a larva 15 minutes after injection of bacteria into the notochord; C is a higher magnification of the boxed region in B. Arrowheads indicate bacteria. Nc, notochordal cell; v, vacuole; pbm, peri-notochordal basement membrane that comprises three layers – o, outer; m, medium (collagen); I, inner. (D-F) The fate and distribution of DsRed-expressing E. coli (red) after infection of muscle with 3000 CFU (D) or notochord with 2000 CFU (E) and 3000 CFU (F). Each larva was followed and imaged at 3 (top row) and 24 (bottom row) hpi. Arrowheads indicate clusters of bacteria. (G-I) Transmission electron microscopy analysis of the notochord of larvae that had been infected in the notochord (11 hpi); H,I show magnifications of regions of G. (G) Numerous bacteria (bracket) are found between the peri-notochordal basement membrane (pbm, arrowheads) and notochord cells (nc). (H) Collagen (col) disorganisation is observed next to bacteria. (I) Extracellularly replicating bacterium (arrowhead). (J) Survival was scored of uninfected larvae and those that were infected in the muscle or notochord (n>24 each). These results are representative of three independent experiments, P<0.0005 for notochord injection versus uninjected. (K) Whole embryo bacterial counts of E. coli when injected into the muscle or notochord. Results are expressed as the mean number of CFU per larvae±s.e.m. (n>5 larvae per timepoint). NS: not significant. Scale bars: 5 μm (B,G); 1 μm (C,H,I). |

Behaviour of neutrophils and macrophages following notochord infection. (A) Diagram showing the regions of the larvae imaged in B and C (dashed boxes). (B) Tg(mpx:GFP) larvae that had been infected with crimson-expressing E. coli (magenta) in the notochord at 48 hpf. The general behaviour of neutrophils (green) was imaged using four-dimensional confocal microscopy, starting at 2 hpi for a duration of 3 hours (the time post-infection is shown in the top right corner). *Neutrophils loaded with bacteria, the arrowhead indicates the injection site. (C) Tg(mpeg1:mCherryF) larvae that had been infected with GFP-expressing E. coli (green) at 48 hpf in the notochord were imaged in the region represented in A to visualise the behaviour of macrophages (red) using four-dimensional confocal microscopy at 1 hpi for a duration of 3 hours and 20 minutes. Scale bars: 20 μm. EXPRESSION / LABELING:
|

Leukocytes do not enter the notochord during the early phase of infection. (A,B) Multiscan confocal analysis at 2 hpi of neutrophils (green) in Tg(mpx:GFP) larvae after muscle (A) or notochord infection (B) with DsRed-expressing E. coli. (C,D) Multiscan confocal analysis of macrophages (red) in Tg(mpeg1:mCherryF) larvae after intravenous (C) or notochord (D) infection with E. coli-GFP (green) at 2 hpi. In A–D, the left panels are xy maximum projections and the right panels are yz cross-section views at the position of the stippled line. Arrowheads show bacteria-containing leukocytes, *Leukocytes that were located next to bacteria but did not contain any. (E–G) Confocal analysis at 24 hpi of the notochord with fluorescent E. coli. Bacteria were no longer visible at 24 hpi. (E,E2) Tg(mpx:GFP) larva showing neutrophils (green), (F,F2) Tg(mpeg1:mCherryF) showing macrophages, (E,F) maximum projection, (E2,F2) single confocal scan. (G) Confocal analysis of a 60-μm cross-section from a double-transgenic larva – neutrophils (green) and macrophages (red) accumulated around the notochord but did not enter this structure, as shown. Scale bars: 10 μm (A–D); 20 μm (E–G). |
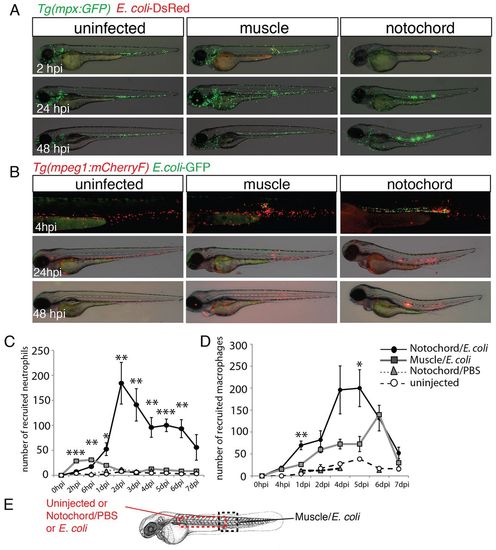
Neutrophils and macrophages are recruited around the infected notochord. (A) Tg(mpx:GFP) larvae were either left uninfected or infected with DsRed-expressing E. coli (red) in the muscle or notochord at 48 hpf. Neutrophil recruitment (green) was imaged repeatedly in individual larvae at the indicated timepoints. (B) A similar experiment to that shown in A was performed in Tg(mpeg1:mCherryF) larvae that were either uninfected or infected with GFP-expressing E. coli (green) in muscle or the notochord at 48 hpf. (C,D) Corresponding counts of neutrophils (C) and macrophages (D) over the course of 1 week post-infection. Results are expressed as the mean number of cells±s.e.m., five to nine fish were examined per timepoint, *P<0.05, **P<0.005 and ***P<0.001. (E) The dashed boxes in the diagram represent the zone where counting was performed. |

Late consequences of notochord infection. (A,B) Histological analysis at 5 dpi of larvae that had been injected in the notochord with PBS (A) or E. coli (B). Cross-sections (4 μm) stained with Masson’s Trichrome. In the infected larvae, collagen-enriched matrixes (blue) and supernumerary vacuoles (V) were seen. Cells inside the notochord (*) and ectopic matrix deposition (arrowhead) can be seen in the sections. (C,D) Neutrophil (green) and macrophage (red) infiltration in the notochord, multiscan confocal microscopy. Cross-sections (60 μm) of Tg(mpx:GFP; mpeg1:mCherryF) larvae at 5 days following injection of the notochord with PBS (C) or with E. coli (D). *Nonspecific staining. (E,F) Notochord of Tg(mpx:GFP) larvae at 3 dpi. (E) Transmitted-light image, overlaid in F with a maximal projection of confocal fluorescence images that show neutrophils (green) clustered at the damaged zone. (G–I) Sudan-black (SB) staining (black) and GFP expression (green) in Tg(mpx:GFP) larvae at 48 hours post-injection of either PBS (G) or E. coli (H,I) into the notochord. Arrowheads indicate neutrophils that have degranulated. (J) Graphic representation of the percentage of GFP+SB cells under the indicated conditions, mean±s.e.m., five or six fish per condition were analysed. *P<0.05 compared with the PBS control. (K) Infected larvae developed scoliosis and dysmorphic vertebrae. Larvae were injected with PBS or E. coli into the notochord at 48 hpf, grown to 60 dpf and fixed for analysis. Bones were stained with Alizarin red. Lateral and dorsal views of the anterior part of the vertebral column are shown. Arrowheads indicate mis-shaped and fused vertebral bodies. Scale bars: 20 μm (A-D,G-I); 50 μm (E,F). |
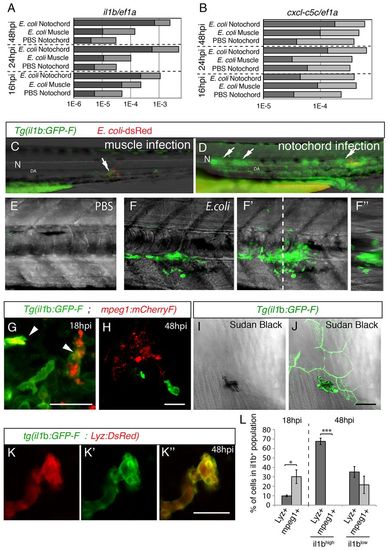
GFP expression in Tg(il1b:GFP-F) infected larvae. (A,B) The relative expression of il1b (A) and of cxcl-c5c (B) at different timepoints post-infection, under three different conditions – PBS injected into the notochord, E. coli injected into muscle and E. coli injected into the notochord. Quantitative real-time RT-PCR on whole embryo RNA extracts using ef1a as a reference gene was performed; light grey bars represent the 95% confidence intervals (Student’s t-test). Non-overlapping light grey bars indicate P<0.05. These results are representative of three independent experiments. (C,D) GFP expression at 24 hpi in Tg(il1b:GFP-F) larvae that had been injected with E. coli (red) into muscle (C) or the notochord (D). Arrows indicate expression next to inflammation sites. N, notochord; DA, dorsal aorta. (E,F) Multiscan confocal analysis of GFP expression in Tg(il1b:GFP-F) larvae in the notochord region 48 hours following the injection of PBS or E. coli. (E-F2) Maximum projections, (F) longitudinal- and (F3) cross-section views. The dashed line indicates the position of cross-section F3 relative to F. (G,H) The expression of mCherry (red) and GFP (green) in Tg(mpeg1:mCherryF ; il1b:GFP-F) double transgenic larvae at 18 (G) and 48 hpi (H) in the notochord region was analysed by using confocal microscopy. Arrowheads indicate macrophages expressing GFP. (I,J) Sudan-black staining and GFP expression in Tg(il1b:GFP-F) larvae was analysed by using confocal microscopy at 48 hpi. The images show a GFP+ neutrophil underneath GFP+ keratinocytes. (K-K3) The expression of DsRed (red) and GFP (green) in Tg(Lyz:DsRed ; il1b:GFP-F) double transgenic larvae at 48 hpi was analysed by using confocal microscopy. A merged image is shown on the right. (L) Quantification of il1b+; mpeg1+ and il1b+; Lyz+ cells in the inflammation region. Counts are expressed as the percentage of cells within the population expressing GFP (il1b+, il1blow or il1bhigh). *P<0.05, **P<0.005 and ***P<0.001. Scale bars: 20 μm. EXPRESSION / LABELING:
|
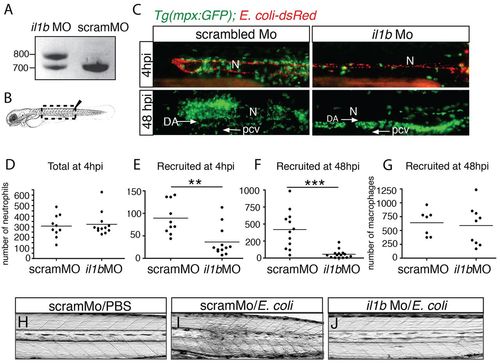
Il1b is required for the early and late recruitment of neutrophils but not macrophages. PCR amplification of il1b cDNA from the 48 hpf intravenous-infected larvae, which had previously been injected with either scambled morpholino (scramMO) or with a morpholino antisense oligonucleotide that blocked the splicing of intron 2 (il1bMO). (B) The diagram shows the region that is imaged in C (dashed box). (C) Recruitment of neutrophils (green) in Tg(mpx:GFP) larvae at 4 hours and 48 hours following the injection of DsRed-expressing E. coli (red) into the notochord. These larvae had been previously injected with scrambled morpholinos (scramMO) or il1b MO. N, notochord. At 48 hpi, many neutrophils were found in the AGM region, in between the dorsal aorta (DA) and the posterior caudal vein (pcv); arrows indicate the direction of blood flow. (D–G) Plots show the number of total neutrophils at 4 hpi (D) and the number of recruited neutrophils at 4 hpi (E) and 48 hpi (F). (G) The number of recruited macrophages at 48 hpi in similar experiments that were performed using Tg(mpeg1:mCherryF) larvae. Each point represents an individual larva, the bar represents the mean value. **P<0.005, ***P<0.001. (H-J) Bright-field images of control (scramMO) and il1b morphants 3 days after injection of either PBS or E. coli into the notochord. Lateral views of the trunk region are shown in C,H,I,J. |
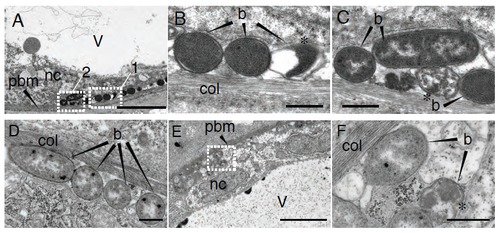
E. coli remains extracellular in the notochord of infected larvae. Ultra-structural analysis using transmission electron microscopy of notochord infected larvae with E. coli, 15 min after infection (A-C) and 2 hpi (D-F). (B) and (C) are high magnification of regions boxed in (A), box 1 and 2, respectively. and (F) of region boxed in (E). Asterisks show bacteria whose morphology is altered. b: bacteria, pbm: peri-notochordal basement membrane, col: collagen sheath, nc: notochordal cell, v: vacuole. Scale bars : 5 μm in A and E, 0.5 μm in B, C, D and F. |

Effect of PBS injection in the notochord on neutrophil recruitment. To check the effect of the injection in the notochord per se on neutrophil recruitment, PBS was injected in the notochord of Tg(mpx:GFP) larvae. No neutrophil was recruited to the notochord (visible with bright-field). To confirm and follow the injection in the notochord, PBS combined with Fluorecein-dextran (green) was injected in the notochord of Tg(mpx:GFP) larvae. Larvae were imaged at different time points following injection: 4, 24, 48 hpi and 4dpi and no recruited neutrophils (green) was detected. |
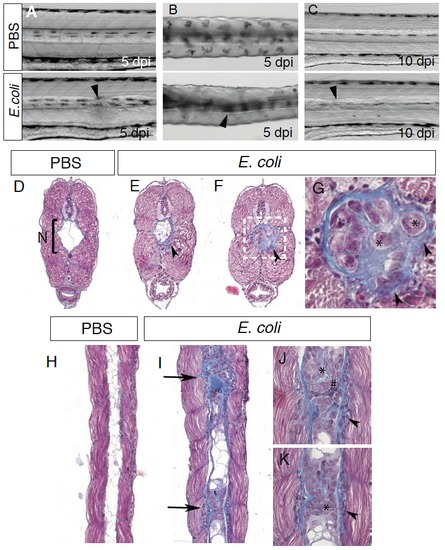
Notochord infection induces notochord defects Bright-field images of PBS or E. coli injected larvae in the notochord at 5 dpi (A-B) and 10 dpi (C). A, C lateral views; B, dorsal view. Arrowheads show defects in the notochord anterior of the injection site (5 to 10 somites away). (D-G) 4 μm cross sections of PBS (D) or E. coli (E-G) injected larvae stained with Masson’s Trichrome. While PBS injected larvae present a notochord (N, bracket) filled mainly with 2 or 3 big vacuolated cells (white) and delimited with a regular, unaffected collagen membrane (blue), E. coli injected larvae present several abnormalities of the notochord. Numerous cells and vacuoles are found inside the notochord. Increase of collagen deposition appears inside and outside the notochord (arrowhead). Many cells are embedded inside the collagen sheath (asterisks). (G) is a high magnification image of the region boxed in (F). (H-K) 4 μm longitudinal sections of PBS (H) or E. coli (I-K) infected larvae stained with Masson’s Trichrome. As described above, PBS injected larvae present a notochord filled mainly with vacuolated cells (H), while E. coli infected larvae present several massive cell aggregates within the notochord (I). In these locations, the notochord is surrounded with cells embedded in the matrix (arrow heads) and cells with different morphologies are found inside the notochord (* and #) (J-K). |

GFP expression in Tg(il1b:GFP-F) embryos and larvae during normal development. (A-B) GFP is not detected during gastrulation: Shield stage, side view with animal pole on top (A) and animal pole view (B). (C-D) GFP is first detected during segmentation in the tail bud, especially in the tip (arrow). (E-I) This expression pattern is seen at 24 and 35hpf, with in addition expression in the olfactory epithelium (F) and in scattered cells on the yolk sac (H). (J-P) From 50 hpf GFP is detected in the tip of the tail and of the caudal fin, especially in the keratinocytes. In addition it is observed in the pectoral fin bud, the retina and the neuromasts. This expression was constant during one month. (C-P) lateral views except (F) (front) and (M) (dorsal). |

transcriptional activation of il1b upon infection with E. coli (A-B) Whole mount in situ hybridization with il1b anti-sense (il1b AS) probe in 5dpf larvae uninfected (A) and infected with E. coli in the notochord (3dpi) (B). Probe signal is detected in the tip of the caudal fin, the skin, the neuromast, eyes (arrows) and gills (asterisks). After infection, larvae overexpress il1b mRNA in the inflamed region (arrowhead). (C) No signal is detected using il1b sense probe (il1b S) (C). (D) GFP (green) expression in Tg(il1b:GFP-F) larvae. Larvae were imaged without infection or at different time points following infection with a DsRed expressing E. coli (red) in the muscle or in notochord. Each column shows images from a single larva image repeatedly. (E-F) Confocal analysis of GFP expression in Tg(il1b:-GFP-F) in the head (G) and the tail (H) regions 24h following E. coli injection. Maximum projections, lateral views, scale bars=20μm. (E′) and (F′) are high magnification images of regions boxed in E and F, respectively. |

GFP expression in Tg(il1b:GFP-F) line recapitulates endogenous il1b mRNA expression in activated leukocytes Trypsinization of 4dpf larvae was used to generate single cell suspensions for FACS sorting, and was found to activate macrophages and neutrophils, allowing us to compare endogenous il1b transcription and GFP expression triggered by a stimulus irrespective of an infection, (A-C) To test whether Tg(il1b:GFP-F) can be used to study the dynamic expression of il1b in activated leukocytes, macrophages (macro), neutrophils (neutro), and non leukocyte cells (neg) were FACS sorted from Tg(mpx:GFP; mpeg1:mCherryF) 4dpf-larvae first injected with either PBS or E. coli. Q-RT-PCR was used to measure the relative expression of mpeg1 (A) and mpx (B) in the different populations, confirming purity of sorted populations. Measurement of il1b expression (C) shows that trypinization and cell dissociation of larvae induced high level of il1b expression in macrophages and neutrophils as compared to non leukocyte cells in both PBS and E. coli injected embryos. Quantifications using ef1a as a reference gene; light grey bar represent 95% confidence interval (student T test). Non-overlapping light grey means p<0.05. (D-E) Using similar conditions to dissociate the embryos, leukocytes were cultured from Tg(il1b:GFP-F; mpeg1:mCherryF) (D) or Tg(il1b:GFP-F; Lyz:DsRed) (E). While no expression of GFP was observed in leukocytes before dissociation (in living larvae, not shown), 90% of the macrophages (red, D) and 100% of the neutrophils (red, E) expressed GFP (green) (arrowheads), showing that Tg(il1b:GFP-F) is a good reporter transgene in leukocytes. Confocal images, Scale bar= 20μm |