
- Title
-
Macrophages modulate adult zebrafish tail fin regeneration
- Authors
- Petrie, T.A., Strand, N.S., Tsung-Yang, C., Rabinowitz, J.S., Moon, R.T.
- Source
- Full text @ Development
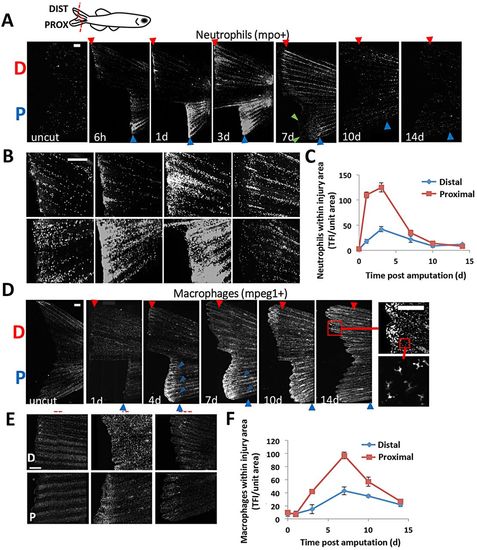
Leukocyte recruitment in regenerating caudal fins follows distinct timelines and aligns with positional memory. (A,B) Representative images detailing a regenerative timecourse of neutrophil accumulation in Tg(mpo:GFP) amputated fish, from uncut through 14dpa. Fish received a dorsal proximal cut (indicated by ‘P’) and a ventral distal cut (‘D’). Fluorescent images were acquired and converted to grayscale for visualization. (C) Neutrophil density was quantified separately for the resected edge of both the proximal and distal cuts (n=9). Total fluorescence intensity of GFP-positive cells was normalized to the injured fin area and used as a correlation for cell number (see Materials and Methods). TFI, total fluorescence intensity. (D,E) Using the same strategy as above, macrophages were tracked in Tg(mpeg1:mCherry) fish during 14days of regeneration. Boxes indicate regions magnified. (F) Quantification of macrophages near the amputation planes for proximal and distal cuts (n=10). Both neutrophils and macrophages accumulate in greater numbers in more proximal (faster regenerating) compared with distally cut tissue. Error bars indicate s.e.m. averages of each experiment. Scale bars: 200μm. |
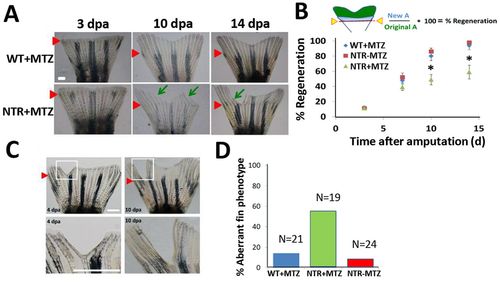
Macrophages modulate caudal fin regeneration rate and phenotype. (A) Macrophages were continuously ablated after fin resection (up to 14dpa) using the macrophage ablation fish line Tg(mpeg1:NTR-eYFP). Fin images are representative of macrophage-ablated (NTR+MTZ) and control (WT+MTZ) fish in at least three independent experiments. Green arrows point to areas of unusually reduced tissue growth and formation; red arrowheads indicate the original fin cut line. (B) Quantification of regenerated tissue as a percentage of original fin area for NTR+MTZ (n=11), WT+MTZ (n=18) and control fish (NTRMTZ, n=14). Full regeneration to the original fin area is considered 100% regeneration. Data are compiled and averaged over three separate experiments using identical conditions. 10dpa, *P=0.0124; 14dpa, *P=0.0262; two-tailed t-test. Error bars indicate s.e.m. averages of each experiment. (C) Representative images at 4dpa and 10dpa of MTZ-treated Tg(mpeg1:NTR-eYFP) caudal fins displaying aberrant tissue phenotypes. (D) Summary of percentage of fish qualitatively assessed for aberrant phenotypes at 14dpa. Scale bars: 300μm. |
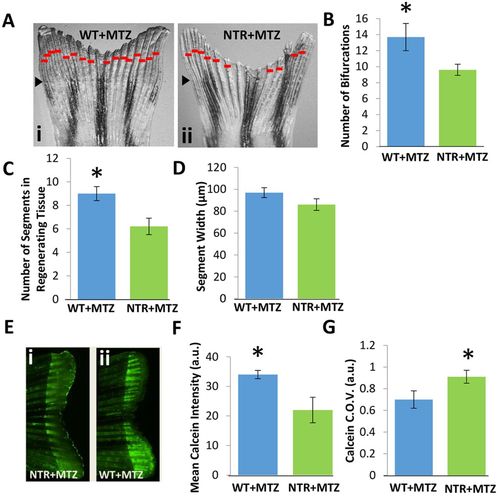
Macrophages modulate bony ray patterning and formation during tissue outgrowth. Macrophages were continuously ablated up to 10dpa. (A) Representative fin images of NTR+MTZ (ii) versus control (i) for at least two independent experiments. Red bars indicate bifurcation points on each ray. Black arrowheads indicate the original fin cut line. (B) Total bifurcations in regenerated tissue are decreased in NTR+MTZ fish compared with wild-type fish. *P=0.030 (two-tailed t-test, error bars indicate s.e. m.). (C) The average number of total segments in each regenerated bony ray is decreased in NTR+MTZ fish compared with WT+MTZ fish. *P=0.040 (two-tailed t-test, error bars indicate s.e.m.). (D) Average segment width for NTR+MTZ and control fins. No significant differences were observed. (E) Fluorescent images of calcein staining in (ii) WT+MTZ and (i) NTR+MTZ fish. Note the less intense and more scattered staining in NTR+MTZ fins compared with WT+MTZ fins. (F) Mean calcein intensity is decreased in NTR+MTZ fish compared with WT+MTZ fish. *P=0.044 (two-tailed t-test, error bars indicate s.e.m.). (G) Coefficient of variation (C.O.V.; a measure of dispersion) for calcein intensity is significantly increased in NTR+MTZ fish compared with wild-type fish. *P=0.047 (two-tailed t-test, three separate experiments, error bars indicate s.e.m.). |
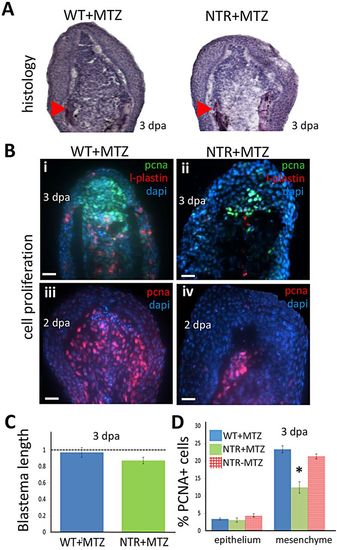
Macrophages modulate the proliferative capacity of the regeneration blastema. (A) Hematoxylin-stained sections of tail fin regenerates (blastemal region) at 3 dpa. Macrophage-depleted fins (right) display slightly reduced numbers of deep mesenchymal cells of the blastema. Arrowheads indicate the plane of amputation. (B) Blastemal and macrophage proliferation assessed by staining 2 (iii,iv) or 3 (i,ii) dpa regenerates for PCNA (i-iv) or L-plastin (i,ii), a marker for leukocytes (mostly macrophages), and with DAPI. Scale bars: 20µm. (C) Quantification of the length of the blastema in macrophage-depleted (NTR+MTZ; n=7) and wild-type (n=6) fins at 3dpa. Macrophage-depleted fins displayed slightly decreased blastemal size compared with wild-type fins. (D) Cell proliferation (PCNA+ cells) quantified in the blastema is reduced in NTR+MTZ compared with wild-type controls. PCNA+ cell number was averaged among all sections spanning the entire fin width, and normalized to DAPI counts in the image. WT+MTZ, n=10; NTRMTZ, n=8; NTR+MTZ, n=9. *P=0.0425 (two-tailed t-test, error bars indicate s.e.m.). |

Macrophages exhibit stage-dependent effects on fin regeneration. (A) Experimental scheme. Macrophages were ablated after fin resection through 3dpa, then allowed to repopulate normally via MTZ washout. (B) Representative fin images at 7 and 14dpa, which is 4 and 11days after macrophage repopulation initiation, respectively. Green arrow indicates irregular fin phenotype, as dictated by non-homogenous growth areas; red arrows indicate original resection plane. (C) Macrophage reduction through 3dpa largely recapitulated the reduction in regenerative outgrowth seen with 14days ablation. Rate of tissue regeneration was reduced in NTR+MTZ (n=11) fish compared with WT+MTZ (n=7) and NTR-MTZ (n=10) fish. Data are averaged over two separate experiments using identical conditions. 7dpa, **P=0.0455; 10dpa, **P=0.0278; 14dpa, **P=0.0220; two-tailed t-test. (D) Quantification of percentage of fish displaying any aberrant phenotype at 14dpa. Total quantification is cumulative from two separate experiments. (E) Experimental scheme. Macrophages were ablated beginning at 3dpa through 14dpa. (F) Representative images at 7 and 14dpa, which is 4 and 11days after the ablation of macrophages had begun, respectively. (G) Delayed macrophage reduction did not significantly reduce the rate of regeneration. Data are averaged over two separate experiments using the same conditions. (H) Quantification of the percentage of fish displaying any aberrant phenotype at 14dpa. Data are cumulative from two separate experiments. Error bars indicate s.e.m. Scale bars: 300μm. |
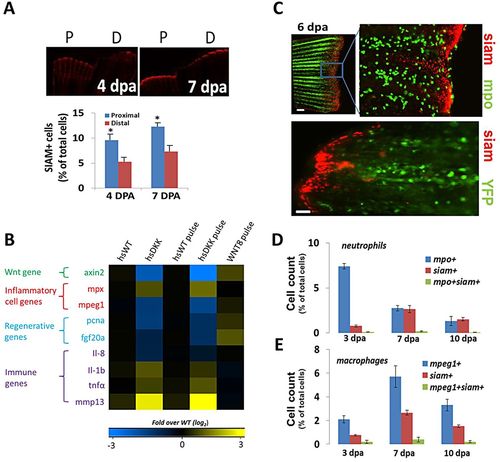
Wnt/β-catenin signaling by non-leukocytes affects the injury environment in regenerating fins. (A) Representative images detailing cells undergoing Wnt/β-catenin signaling (siam+, red) for proximal and distal fin resections in Tg(TCFsiam:mCherry) fish. Siam+ cell number is increased in proximal cuts. 4dpa, *P=0.0329; 7dpa, *P=0.0296 (two-tailed t-test, error bars indicate s.e.m.). (B) Gene expression levels (4dpa) of pooled blastemal fin tissue (n>5) as assessed by qRT-PCR for wild-type and for the Tg(hsDKK1:GFP) loss-of-function and Wnt8a (hsWnt8a:GFP) gain-of-function Wnt/β-catenin signaling fish lines. Levels were normalized to fold over non-heat shock control. Data were averaged over two separate experiments. One group included daily heat shock following amputation; the other group included a single heat shock pulse at 84hpa with tissue extraction 12h later at 4dpa. mpx is mpo. (C) Representative images of distal resections from Tg(mpo:GFP; TCFsiam:mCherry) fish and Tg(mpeg1:NTR-YFP; TCFsiam:mCherry) fish at 6dpa. Little colocalization is evident between neutrophils (mpo+) and siam+ cells. Scale bar: 40µm; 100µm in bottom panel. (D) Quantification of flow cytometry sorted cells from pooled resected fins (n=8) from Tg(mpo:GFP; TCFsiam:mCherry) fish indicating the presence of few mpo+ siam+ cells. (E) Quantification of flow cytometry sorted cells from pooled resected fins (n=7) from Tg(mpeg1:NTR-eYFP; TCFsiam:mCherry) fish indicating the presence of few mpeg1+ siam+ cells. (D,E) Error bars indicate s.e.m. of the average of three experiments. |
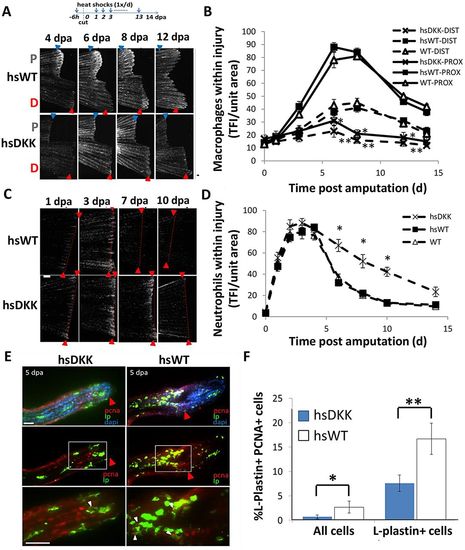
Wnt/β-catenin signaling regulates leukocyte response to injury. (A) The loss-of-function Wnt/β-catenin signaling line Tg(hsDKK1:GFP) crossed to the Tg(mpeg1:mCherry) line was used to track macrophages after Wnt modulation. Resected wild-type or loss-of-function Wnt/β-catenin signaling (hsDKK) fins received a proximal cut and a distal cut. Representative images are shown of macrophage accumulation through 12dpa. Fluorescent images were acquired and converted to grayscale for ease of visualization. (B) Macrophage accumulation was reduced in DKK1-overexpressing fins at every time point from 3dpa until 14dpa and no significant difference in macrophage number was observed between proximal and distal resections. Data are representative of at least three independent experiments with at least six to eight fish per time point. HsDKK-PROX versus hsWT-PROX, WT-PROX: 6dpa, *P=0.0083; 8dpa, *P=0.0072; 12dpa, P=0.0175. HsDKK-DIST versus WT-DIST, WT-DIST; 6dpa, **P=0.0140; 8dpa, **P=0.0195; 12dpa, **P=0.0361; two-tailed t-test. (C) Tg(hsDKK1:GFP) was crossed to a neutrophil promoter-driven Tg(lyzC:dsRed) line in order to visualize neutrophil accumulation following Wnt inhibition. Representative images indicate that neutrophil accumulation remains elevated longer in DKK1-overexpressing fins compared with wild-type controls. (D) Neutrophil accumulation was higher in DKK1-overexpressing fins compared with wild-type controls after 5dpa. Data are representative of three independent experiments with at least six to eight fish per time point/condition. hsDKK1 versus hsWT, WT: 6dpa, *P=0.0075; 8dpa, *P=0.0112; 10dpa, *P=0.0105; two-tailed t-test. (E) Proliferation of wild-type and DKK1-overexpressing regenerates at 5dpa as assessed by anti-PCNA (red), anti-L-plastin (green) and DAPI (blue) staining. Red arrowheads indicate original cut site; white arrowheads indicate double-stained (PCNA+ LP+) cells. The boxed regions are magnified beneath. (F) Proliferating macrophages as a percentage of total cells and total macrophages (LP+ cells). Numbers were averaged over at least seven sections of each sample. Data are representative of three independent experiments (n>5). hsDKK1 versus hsWT: *P=0.0475; **P=0.0349 (two-tailed t-test, error bars indicate s.e.m.). Scale bars: 200μm in A; 300μm in C; 20μm in E. |
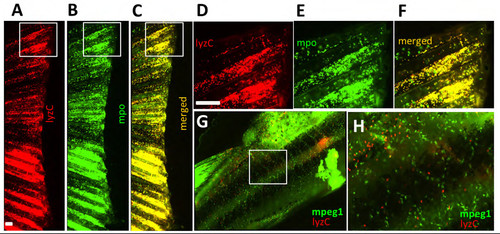
Adult neutrophils are characterized by lysozyme C (lyzC) and myeloperoxidase (MPO) expression. (A-F) Amputated fins from Tg(lyzC:dsRed) and Tg(MPO:GFP) fish; (D-F) are insets of (A-C). (G,H) Tg(mpeg1:YFP; lyzC:dsRed) body midline indicating that macrophages (mpeg1+) do not overlap with lyzC+ cells. |
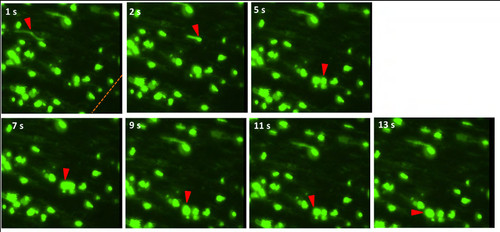
Neutrophils migrate through circulation to wound site and adhere to endothelium at injury. Time sequence of a neutrophil in Tg(mpo:GFP) fish circulating through inter-ray caudal fin vein after 4 hpa, slowing, and adhering to endothelial walls, and beginning to extravagate outward to interstitial tissue at wound site. Red arrows refer to neutrophil undergoing rolling adhesion. |

Neutrophil deficiency near amputation plane does not affect regeneration. (A) Experimental scheme. Adult Tg(mpo:GFP) fish were incubated in diphenyleneiodonium chloride (DPI) at 30 μM for 12 h before caudal fins were amputated with a distal resection. DPI was added to fish water daily for 3 dpa. After 3 dpa, fish were incubated in water without DPI for the rest of the experiment (10 dpa). Yellow arrowheads represent cut plane. (B) Neutrophil (mpo+) density near the injury area was reduced with DPI treatment. Representative images of mpo+ cells near the amputation plane at 2 dpa. Scale bar = 100 μm. (C) Rate of fin regeneration was not significantly different between DPI-treated (DPI) (N=7) and untreated (DMSO) (N=6) fish for duration of experiment. Error bars represent the s.e.m. Data representative of two separate experiments. |
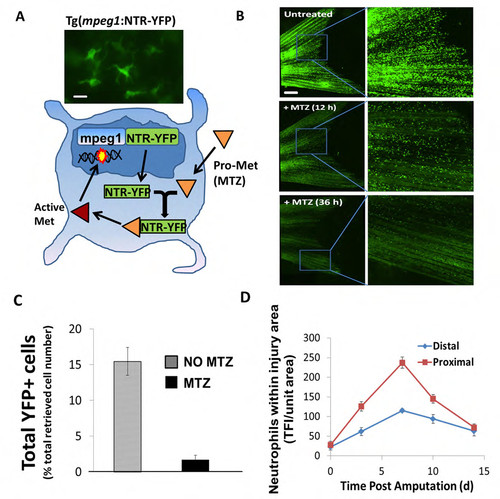
Tg(mpeg1:NTR-YFP) fish line affords inducible systemic ablation of macrophages. (A) Schematic of a new inducible macrophage ablation fish line Tg(mpeg1:NTR-eYFP) made using NTR/MTZ technology. Briefly, fish expressing the mpeg1 promoter ubiquitously express a fusion NTR-YFP protein. Addition of metronidazole (MTZ) in fish water results in catalytic electron transfer and activation of Met in cells expressing NTR fusion protein. Activated Met promotes DNA breaks and ultimately cell death. Representative image of mpeg1+ cell (macrophage) in upper panel. Scale bar = 10 μm. (B) Macrophages (mpeg1+) are easily visualized throughout the caudal fin in Tg(mpeg1:NTR-eYFP) fish as green YFP+ fluorescent cells (upper panels). Subsequent incubation in 2.5 mM MTZ for 12h and 36h results in dissipation of this green signal and significant reduction of overall numbers of macrophages throughout the fish, including the caudal fin (lower panels). Scale bar = 200 μm. (C) MTZ-induced cell ablation in Tg(mpeg1:NTR-eYFP) fish as assessed in uninjured +/- MTZ treated fins via flow cytometry shows an 80-90% reduction in eYFP+ cells post-MTZ treatment (2d). Flow cytometry was conducted on pooled samples (NTR+MTZ, N=8-10; NTR-MTZ, N=8-10). Data is representative of 3 separate experiments. Error bars are S.E.M. (D) Quantification of macrophage cell number near the amputation planes for both the proximal and distal cuts (N=7) from uncut to 14 dpa in Tg(mpeg1:NTR-eYFP) fish. Data is representative of 2 separate experiments. |
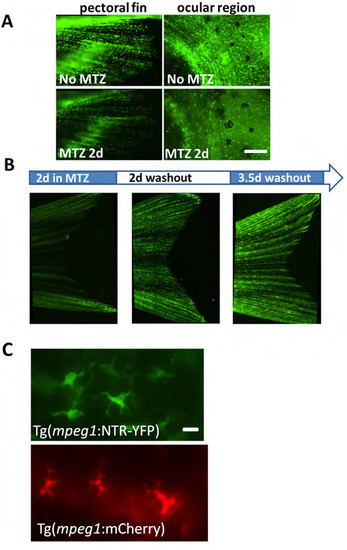
Macrophage ablation is inducible and systemic in Tg(mpeg1:NTR-YFP) fish. (A) Macrophages are easily visualized throughout the pectoral fin and ocular area in Tg(mpeg1:NTR-eYFP) fish and addition of MTZ (for 2d) visually decreases macrophage number. Scale bar = 60 μm. (B) Macrophage ablation is reversible by MTZ washout. Incubation of transgenic fish in MTZ for 36 h ablates most macrophages, and subsequent incubation in non-drug fish water for >2d results in gradual restoration of overall numbers of macrophages throughout the fish, including the caudal fin. (C) Close-up images of mepg1+ and YFP+ cells in Tg(mpeg1:mCherry) and Tg(mpeg1:NTR-eYFP) fish in the caudal fin. Scale bar = 20 μm. |

Macrophage depletion is maintained in adult caudal fins through 14 dpa. (A,B) Transverse and flat sections of Tg(mpeg1:NTR-YFP) amputated caudal fins at 7 dpa and 14 dpa with continuous MTZ treatment (NTR+MTZ) and without (NTR-MTZ). (C) Flow cytometry of pooled 14 dpa fins gated for YFP+ (macrophages) and Dapi-( live cells) in NTR-MTZ and NTR+MTZ fish. (D) Quantification of flow cytometry of Dapi-YFP+ population as a percentage of total events for 14 dpa pooled fins Error bars represent the s.e.m. data representative of 2 separate experiments. (E) Representative fin images (YFP) for temporally ablated fish at 3 dpa (where either MTZ was washed out or MTZ added for the first time) and 5 dpa. Scale bar = 200 μm. |
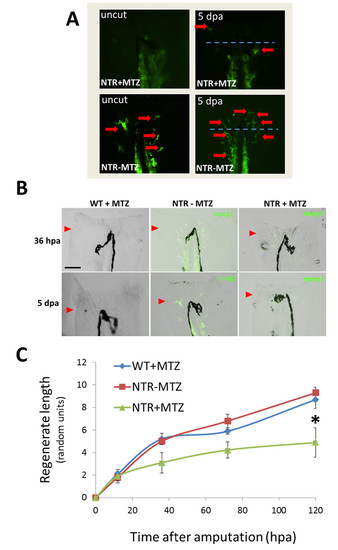
Macrophage depletion negatively affects larval fin regeneration. (A) cMacrophages were continuously ablated before and after larval fin resection (up to 5 dpa) using the macrophage ablation fish line Tg(mpeg1:NTReYFP). Representative YFP images of macrophages in both uncut and 5 dpa transgenic larvae. Red arrows indicate individual macrophages. Blue dotted line indicates original cut site. (B) Representative whole fin hybrid DIC/YFP images of wild-type fish or Tg(mpeg1:NTR-eYFP) fish undergoing continuous macrophage ablation after resection. Red arrows point toward original cut line. (C) Quantification of regenerated tissue as a percentage of original fin area for macrophage-ablated fish (NTR+MTZ, N=9), wild type fish (WT+MTZ, N=11) and transgenic fish controls (NTR-MTZ, N=14). Full regeneration to the original fin area is identical to 100% regeneration. Numbers are compiled and averaged over two separate experiments using identical conditions. *P (5dpa) = 0.0314 (two-tailed). |

Wnt signaling inhibition delays neutrophil resolution in amputated larval fins. (A) Representative images (24 hpa) of a loss-of-function Wnt/β-catenin signaling line Tg(hsDKK1:GFP) crossed to a Tg(lyzC:dsRed) line to detail a regenerative timecourse of neutrophil accumulation in larval fins near the injury site. Fins on wildtype (WT) or loss-of-function Wnt/β-catenin signaling fish (hsDKK) were resected, and heat shocked once daily (hsWT, hsDKK) for 80 hpa. (B) Quantification of neutrophil accumulation in injury area after fin amputation for hsDKK and WT fish indicating increased cell number in DKK1-overxpressing fins at time points from 16 hpa through 60 hpa. (C) Quantification of neutrophil accumulation in injury area after fin amputation in gain-of-function Wnt/β-catenin signaling line Tg(hsWnt8a:GFP) crossed to a Tg(lyzC:dsRed) line. Unlike loss-of-function Wnt/β- catenin signaling fish (hsDKK1), Wnt8a-overexpressing larvae show no significant difference in macrophage number with hsWT. Data are representative of three independent experiments with at least 6-8 fish per timepoint. Error bars represent the s.e.m. * vs hsWT; P(16 hpa)=0.0140, P(20 dpa) = 0.0125, P(28 dpa) = 0.0399. |