
- Title
-
Setdb2 controls convergence and extension movements during zebrafish gastrulation by transcriptional regulation of dvr1
- Authors
- Du, T.T., Xu, P.F., Dong, Z.W., Fan, H.B., Jin, Y., Dong, M., Chen, Y., Pan, W.J., Ren, R.B., Liu, T.X., Deng, M., Huang, Q.H.
- Source
- Full text @ Dev. Biol.
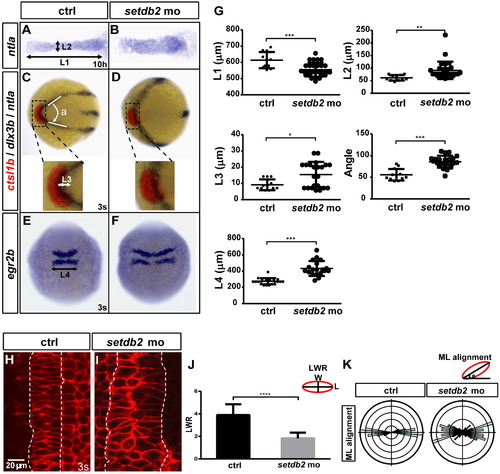
Setdb2 knockdown induces defects in C&E movements during gastrulation. (A–G) Whole-mount in situ hybridization and statistical analyses of the expression patterns of ntla, ctsl1b, dlx3b and egr2b at the indicated developmental stages in embryos injected with setdb2 control mo or setdb2 mo. Insets show magnified views of the relative position of ctsl1b and dlx3b. The dorsal views on embryos in A and B were flat-mounted. Embryos were animal views in C and D with head to the left and dorsal views in E and F with head to the top. L1 and L2, the length and width of the notochord at 10 hpf; L3, the length of the posterior shift of prechordal plate relative to the overlying neural plate; Angle, between the two sides of neural plate; L4, the width of rhombomeres 3 and 5. Asterisks indicate statistically significant differences (*, P<0.05; **, P<0.01; ***, P<0.001). (H–K) Representative confocal images of notochord cells in setdb2 control embryos (n=4 embryos, 80 cells) and setdb2 morphants (n=4 embryos, 80 cells) co-injected at the one-cell stage with 100 pg mRNA coding for membrane-targeted RFP. Anterior is upwards. The boundaries of the notochord are marked with dotted white lines. Length-width ratio (LWR) of notochord cells and mediolateral alignment (ML alignment) at the 3-somite stage were measured with ImageJ2X. The rose diagrams were drawn using Rose.NET. Scale bar: 20 μm. The statistical significance of difference is indicated by asterisks (****, P<0.0001). EXPRESSION / LABELING:
PHENOTYPE:
|
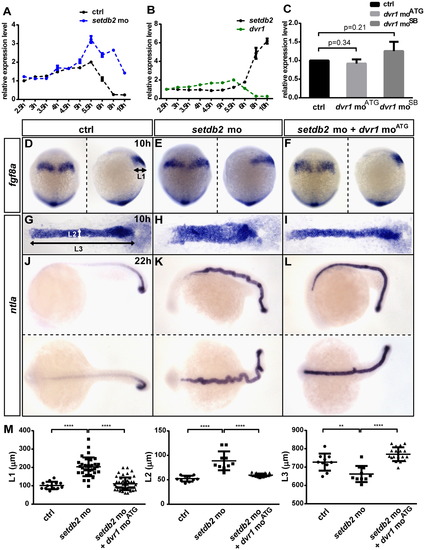
Dvr1 acts downstream of Setdb2 to affect C&E movements. (A) The relative expression levels of dvr1 in control and setdb2 morphant embryos from 2.5 hpf to 10 hpf. The upregulation of dvr1 was firstly detected at 5.5 hpf in the setdb2 morphants. (B) The relative expression levels of setdb2 and dvr1 from 2.5 hpf to 10 hpf in wild-type embryos. (C) The expression of the setdb2 gene was unaffected in two types of dvr1 morphants compared to the control. Gapdh expression was analyzed as a control in quantitative real-time PCR. (D-L) dvr1 moATG partially rescued the C&E movement defects of setdb2 morphants. The embryos were injected at the one-cell stage with 16 ng setdb2 control mo, 16 ng setdb2 mo or 16 ng setdb2 mo plus 4 ng dvr1 moATG. Whole-mount in situ hybridization of the expression patterns of fgf8a and ntla were performed at the indicated developmental stages. L1, the width of the presumptive hindbrain at 10 hpf; L2 and L3, the width and length of the notochord. Dorsal views of embryos in G-I were flat-mounted. Embryos were dorsal views in left side of D–F with head to the top and lateral views in right side of D-F. Embryos were lateral views in upper of J–L and dorsal views in nether of J–L with head to the left. (M) Statistical analyses of the expression patterns of fgf8a and ntla were performed. Asterisks indicate statistically significant differences (**, P<0.01; <****, P<0.0001). EXPRESSION / LABELING:
PHENOTYPE:
|
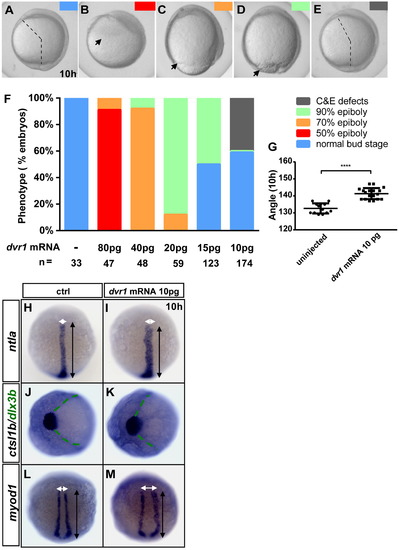
Forced expression of dvr1 impairs epiboly and C&E movements. (A–F) Embryos were either uninjected or injected with 80, 40, 20, 15 or 10 pg dvr1 mRNA at the one-cell stage and were imaged at 10 hpf. Base on the severity and stage of morphological phenotypes, the embryos were grouped into normal bud stage (blue), 50% epiboly (red), 70% epiboly (orange), 90% epiboly (green) and C&E defects (gray). Statistical analyses of the phenotypes are shown in F. The dotted lines in A and E indicate the angle between the most anterior and posterior ends of the body axis. The arrows in B-D indicate the front edge of epiboly process. All embryos were lateral view. (G) The average extension angle of uninjected embryos and embryos injected with 10 pg dvr1 mRNA which had impaired extension (approximately 40% of total 10 pg dvr1 mRNA injected embryos) was plotted. The statistical significance of this difference is indicated by asterisks (****, P<0.0001). (H-M) Embryos at one-cell stage were injected with control or dvr1 mRNA (50 pg EGFP mRNA or 10 pg dvr1 mRNA) and stained with RNA probes for ntla, ctsl1b, dlx3b and myod1 at 10 hpf. White and black double-headed arrows denote the width and length of the notochord and somites, respectively. The green dotted lines indicate the angle between the two sides of the neural plate. Embryos were dorsal view in H-I and L-M with head to the top and animal view in J and K with head to the left. EXPRESSION / LABELING:
|
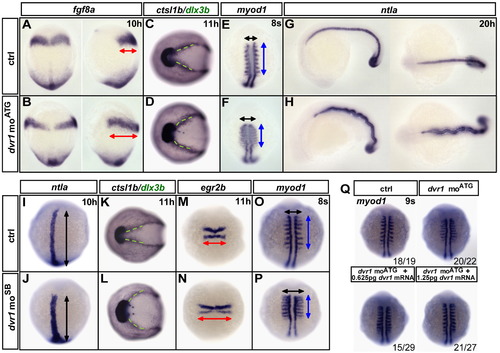
Knockdown of the dvr1 gene leads to abnormal C&E movements. (A–H) Whole-mount in situ hybridization for fgf8a, dlx3b, ctsl1b, myod1 and ntla were performed in control and dvr1 moATG morphants at the indicated developmental stages. (I–P) Whole-mount in situ hybridization for ntla, dlx3b, ctsl1b, egr2b and myod1 were performed in control and dvr1 moSB morphant embryos at the indicated developmental stages. The percentage of phenotypes were as follows: (J) 17/19 (ntla), (L) 42/44 (dlx3b), 13/44 (ctsl1b), (N) 23/25 (egr2b), (P) 34/34 (myod1). Red double-headed arrows denote the width of the presumptive hindbrain in the lateral view or the width of rhombomeres 3 and 5 in the dorsal view. Green dotted lines indicate the angle between the two sides of the neural plate. Black and blue double-headed arrows show the width and length of somites in E-F and O-P, respectively. Black double-headed arrows in I and J indicate the length of the notochord. Embryos were dorsal view in left side of A-B, E-F, I-J and M-P with head to the top, animal view in C-D and K-L with head to the left, lateral view in right side of A and B with head to the top, lateral view in left side of G and H and dorsal view in right side of G and H with head to the left. (Q) The C&E defects were specifically caused by Dvr1 inhibition. Whole-mount mRNA in situ hybridization of the expression pattern of myod1 in control, dvr1 moATG-injected and dvr1 moATG plus dvr1 mRNA-injected embryos at 9-somite stage. EXPRESSION / LABELING:
PHENOTYPE:
|
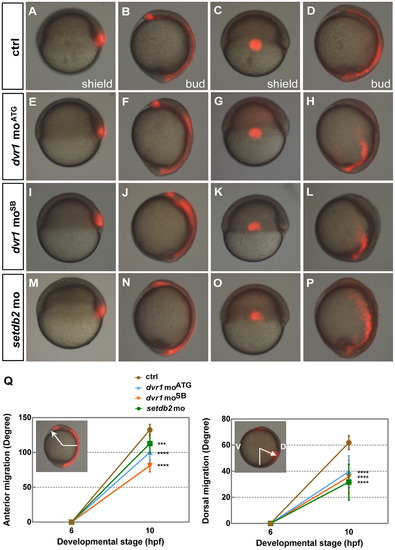
Identification of the essential role of Dvr1 in C&E cell movements using a cell-tracing strategy. (A–P) Tracking cell movements in C&E using UV-mediated photoactivation. At the one-cell stage, the embryos were injected with either 100 pg mRNA coding for Kaede protein plus dvr1 control morpholino or kaede mRNA plus dvr1/setdb2 morpholinos. Embryos were labeled by UV radiation at the shield stage and analyzed at the tail-bud stage. Dorsal mesendodermal cells in control (A,B, n=13), dvr1 moATG (E,F, n=21), dvr1 moSB (I,J, n=10) and setdb2 mo (M,N, n=14). Lateral mesendodermal cells in control (C,D, n=13), dvr1 moATG (G,H, n=22), dvr1 moSB (K,L, n=10) and setdb2 mo (O,P, n=18). (Q) Statistical analysis of anterior migration of labeled dorsal mesendodermal cells and dorsal migration of lateral mesendodermal cells. All images were lateral views. Asterisks indicate statistically significant differences (***, P<0.001; ****, P<0.0001). V, ventral side. D, dorsal side. |
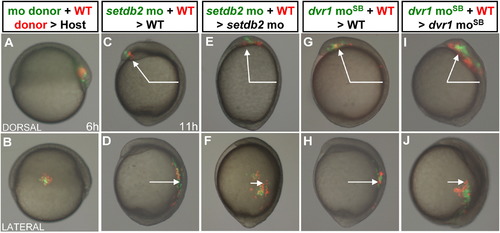
The setdb2-dvr1 transcriptional cascade regulates C&E cell movements in a non-cell-autonomous manner. (A-B) Representative images of transplantation for analysis of C&E cell movements at the shield stage. Red and green cells are those labeled with Rhodamine-dextran or fluorescein-dextran in donor embryos, respectively. (C-D) Dorsal or lateral mesendodermal cells derived from wild-type and setdb2-mo donor embryos, respectively, were transplanted into the corresponding regions of wild-type host embryos at the shield stage and imaged at 11 hpf. (E-F) Dorsal or lateral mesendodermal cells derived from wild-type and setdb2-mo donor embryos, respectively, were transplanted into the corresponding regions of setdb2 mo-injected host embryos at the shield stage and imaged at 11 hpf. (G-H) Dorsal or lateral mesendodermal cells derived from wild-type and dvr1 moSB donor embryos, respectively, were transplanted into the corresponding regions of wild-type host embryos at the shield stage and imaged at 11 hpf. (I-J) Dorsal or lateral mesendodermal cells derived from wild-type and dvr1 moSB donor embryos, respectively, were transplanted into the corresponding regions of dvr1 moSB-injected host embryos at the shield stage and imaged at 11 hpf. The percentages of phenotypes were as follows: (C) 7/9, (D) 6/6, (E) 7/8, (F) 9/9, (G) 8/10, (H) 6/6, (I) 8/8, (J) 9/10. The angles in C, E, G and I indicate the anterior migration of dorsal mesendodermal cells after transplantation. The white arrows in D, F, H and J indicate the dorsal migration of lateral mesendodermal cells after transplantation. All embryos were lateral views with head to the top. |

Efficiency test of setdb2 and dvr1 morpholinos. (A) Knockdown of Setdb2 protein by specific morpholino in vivo. Western blot analysis of embryos injected with setdb2 control or setdb2 morpholinos at the indicated dos. Every control and morpholino sample had one repeat as shown. The proteins extracted from 20 embryos at 24 hpf were loaded into each lane. Histone H3 was used as a loading control. (B) Knockdown efficiency of dvr1 moATG. Schematic presentation of the reporter plasmid used to test the efficiency of morpholino knockdown. The full-length 5′UTR and immediate 159-nt downstream of translational start codon (ATG) of dvr1 were fused to the ATG-deleted open reading frame of EGFP in the pCS2+ plasmid. The red bar denoted the targeted site recognized by morpholino. Co-injection of EGFP reporter mRNA with either control or dvr1 moATG into wild-type embryos. Fluorescent stereomicroscope showed EGFP expression at 8 hpf. Co-injection of mcherry mRNAs was used as a control. (C) Knockdown efficiency of dvr1 moSB. Schematic representation of dvr1 moSB target site. Quantitative real-time RT-PCR analysis of dvr1 mRNA level in the embryos injected with either control or 16 ng dvr1 moSB at different developmental stages. Results were presented as means ± SD from three independent experiments. Zebrafish housekeeping gene gapdh was used as an internal control for data normalization. Asterisks indicate statistically significant differences (***P<0.001). |

Setdb2 knockdown induces defects of C&E movements. (A–D) Zebrafish embryos at one-cell stage injected with 16 ng setdb2 control mo or setdb2 mo were imaged at 10 hpf and 3-somite stage, respectively. The dotted lines indicate the angle between the most anterior and posterior end of the body axis. All embryos were lateral views. (E) The average angle of the extension was plotted. Student t-tests were performed and the statistical significance of difference was indicated by asterisks (*, P<0.05; ***, P<0.001). |

Setdb2 or Dvr1 knockdown and overexpression of dvr1 induce defects of cell polarity at the tail-bud stage. (A–D) Representative confocal images of notochord cells in control embryos (n=4 embryos, 80 cells), setdb2 morphants (n=4 embryos, 80 cells), dvr1 morphants (moATG) (n=4 embryos, 80 cells) and dvr1 mRNA overexpression embryos (n=4 embryos, 80 cells) co-injected at the one-cell stage with 100 pg mRNA coding for membrane-targeted RFP. Anterior is upwards. The boundaries of the notochord are marked with dotted white lines. (E-F) Length-width ratio (LWR) of notochord cells and mediolateral alignment (ML alignment) at the tail-bud stage were measured with ImageJ2X. The rose diagrams were drawn using Rose.NET. Scale bar: 20 μm. The statistical significance of difference is indicated by asterisks (**, P<0.01; ****, P<0.0001). |
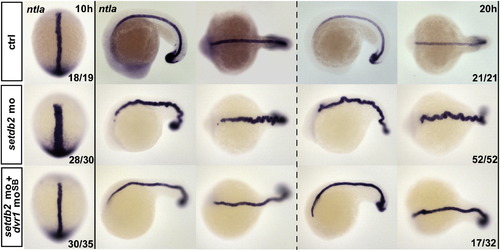
Dvr1 moSB partially rescues the C&E movement defects of setdb2 morphants. The embryos were injected with setdb2 control mo, 16 ng setdb2 mo alone, or 16 ng setdb2 mo plus 0.4 ng dvr1 moSB at one-cell stage. Whole-mount in situ hybridization of the expression pattern of ntla and myod1 were performed at the indicated developmental stages. |

Forced expression of dvr1 leads to undulated notochord at 22 hpf. Embryos at one-cell stage were injected with control (50 pg EGFP mRNA) or dvr1 mRNA (25 or 50 pg dvr1 mRNA) and stained with RNA probes for ntla at 22 hpf. The percentage of undulated notochord phenotypes were as follows: (B) 44/48, (C) 46/88. Among embryos injected with 25 or 50 pg dvr1 mRNA, some of them could not complete the gastrulation process at 22 hpf, the percentage of gastrulation defects were as follows: 4/48 (25 pg dvr1 mRNA), 42/88 (50 pg dvr1 mRNA). |

Maternal but not zygotic expression of dvr1 gene may modulate cell fate specification. (A) The embryos were injected with control mo or dvr1 morpholinos and detected by whole-mount in situ hybridization with probes (chd, gsc, flh, cyc, bmp4, bmp2b, ntla, tbx6) at 6 hpf. The first row of left side in A was imaged under bright field. (B) Quantitative PCR of gsc, bmp4 and bmp2b gene expression at 6 hpf. Student t-tests were performed and the statistical significance of difference was indicated by asterisks (****, P<0.0001). |
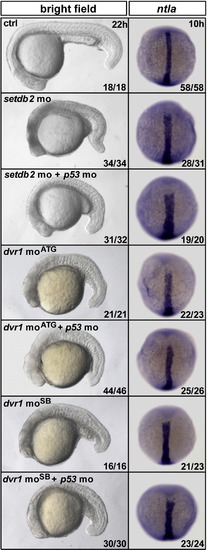
The defects of C&E movements cannot be rescued by p53 morpholino in setdb2 and dvr1 morphants. The embryos injected with setdb2 mo or two types of dvr1 morpholinos exhibited cell death in the brain and trunk. The characteristic apoptosis could be rescued by co-injecting with p53 mo. p53 mo could not rescue the wider and shorter notochord (ntla) in setdb2 or dvr1 morphants. |
Reprinted from Developmental Biology, 392(2), Du, T.T., Xu, P.F., Dong, Z.W., Fan, H.B., Jin, Y., Dong, M., Chen, Y., Pan, W.J., Ren, R.B., Liu, T.X., Deng, M., Huang, Q.H., Setdb2 controls convergence and extension movements during zebrafish gastrulation by transcriptional regulation of dvr1, 233-44, Copyright (2014) with permission from Elsevier. Full text @ Dev. Biol.