
- Title
-
The Right Dorsal Habenula Limits Attraction to an Odor in Zebrafish
- Authors
- Krishnan, S., Mathuru, A.S., Kibat, C., Rahman, M., Lupton, C.E., Stewart, J., Claridge-Chang, A., Yen, S.C., Jesuthasan, S.
- Source
- Full text @ Curr. Biol.
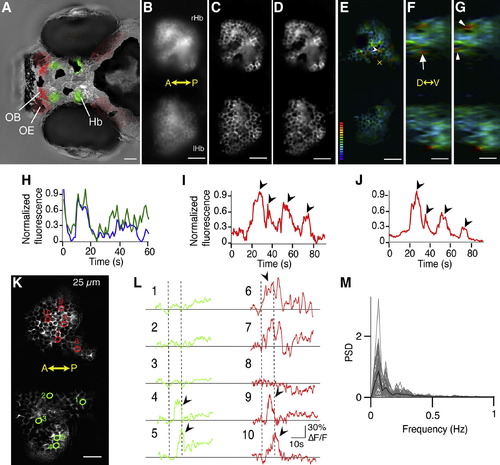
Imaging Neural Activity in the Habenula with Wide-Field Microscopy (A) A fish with GCaMP3 expression in the habenula (Hb) under the control of the Et(GAL4s1011t) driver. Olfactory sensory neurons that innervate the olfactory bulb (OB) are labeled in red using the Et(SqKR15-3a) line. (B) A raw image of the habenula obtained with wide-field microscopy. (C and D) A deconvolved image of the same plane, following imaging of a stack at the optimal 0.6 µm step size (C) and using only planes separated by 3 µm (D). (E) A ratio image (F/F0) showing intensity at a time point relative to the average intensity of each pixel across the time series. Each cell is distinct. The arrowhead indicates a single cell with a 2.5-fold increase in fluorescence, surrounded by cells with less or no increase in fluorescence. The color bar shows the lookup table used, which ranges from a ratio of 0 to 2.5. (F and G) A transverse section through the stack in (E), at the region indicated by the cross, spanning 20 planes. Two time points, 1 s apart, are shown. The white arrowheads indicate cells whose fluorescence increases, whereas the arrow indicates a cell whose fluorescence decreases. Vertically adjacent cells can have different colors, indicating different F/F0 values. (H) Minimum to maximum (min-max) normalized raw intensity from two vertically adjacent cells. The traces have some similarity but follow independent trajectories. (I and J) Min-max normalized raw intensity change over time for a single cell before (I) and after (J) deconvolution. (K) A single focal plane 25 µm from the dorsal surface of the habenula, imaged at 33 Hz. (L) Traces (ΔF/F) of fluorescence intensity in different regions of interest (ROIs) as marked in (K). GCDA was delivered for 10 s, marked by the vertical dashed black lines. The horizontal black lines represent ΔF/F = 0. Arrowheads indicate examples of odor-evoked activity. (M) Normalized PSD of raw fluorescence from all identified cells in (K). Grey lines represent PSDs for individual cells. The thick black line indicates mean PSD. A, anterior; P, posterior; D, dorsal; V, ventral; Hb, habenula; lHb, left habenula; rHb, right habenula; OB, olfactory bulb; OE, olfactory epithelium. Scale bars represent 50 µm in (A) and 20 µm in (B)–(G) and (K). All images are dorsal views except (F) and (G), which are made from 20 optical planes. See Figure S1. |