- Title
-
Organizer-derived Bmp2 is required for the formation of a correct Bmp activity gradient during embryonic development
- Authors
- Xue, Y., Zheng, X., Huang, L., Xu, P., Ma, Y., Min, Z., Tao, Q., Tao, Y., Meng, A.
- Source
- Full text @ Nat. Commun.
|
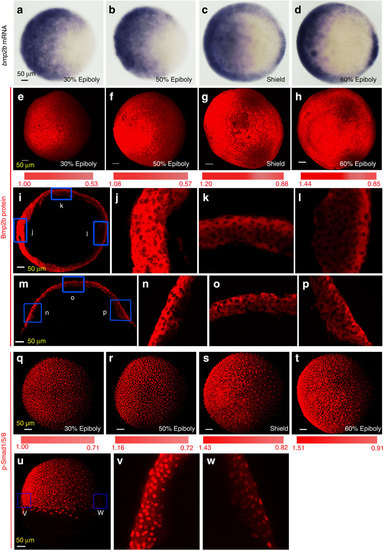
(a–d) Distribution of bmp2b transcripts revealed by whole-mount in situ hybridization at indicated stages. All embryos were animal-pole views with dorsal to the right. (e–h) Confocal microscopic detection of Bmp2b protein in whole embryos. Embryos at indicated stages were immunostained using an anti-Bmp2b antibody. The z-stack images were shown in animal-pole view with dorsal to the right. The colour bar in (e–h) illustrated signal level changes. The ratio of Bmp2b/DAPI at the two extremes was calculated and indicated. Embryos (3–5), 2–3 sections per embryos, were analysed for each group (also see Supplementary Fig. 2b, c). (i–p) Confocal microscopic detection of Bmp2b proteins in cryostat sections of embryos at the shield stage. The equatorial (i) or meridional (m) sections, which passed the organizer, were immunostained using an anti-Bmp2b antibody, and the representative z-stack images were orientated with dorsal to the right. The boxed regions in (i) and (m) were enlarged and shown in j–l and n–p, respectively. (q–t) Confocal microscopic detection of p-Smad1/5/8. Embryos were immunostained using an anti-p-Smad1/5/8 antibody. The representative z-stack images were shown in animal-pole view with dorsal to the right. (u–w) Distribution of p-Smad1/5/8 in a shield stage embryo. The embryo was laterally viewed with dorsal to the right (u) and boxed ventralmost (v) and dorsalmost (w) areas were enlarged from an optical meridional section. |
|
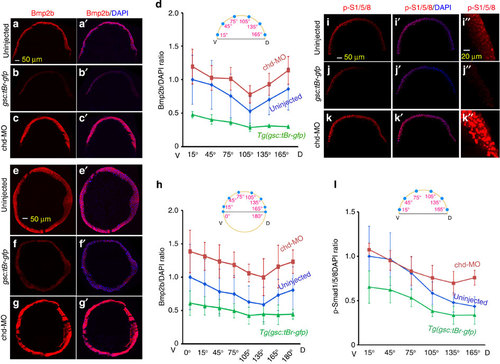
(a–d) Changes in Bmp2b protein distribution on meridional sections of differently treated embryos. Meridional cryostat sections passing the organizer of WT (a,a2), Tg(-2,067gsc:tBr-gfp) (b,b2) or chd-MO-injected (c,c2) embryos at the shield stage were immunostained using an anti-Bmp2b antibody along with DAPI staining. The representative confocal images were orientated with dorsal to the right. The average Bmp2b/DAPI signal ratios for indicated ventrodorsal regions of each group of embryos were shown in d. Injection doses (same for others): 105 pg Tg(2,067gsc:tBr-gfp) plasmid DNA; 2.1 ng chd-MO. (e–h) Changes in Bmp2b protein distribution on equatorial sections of differently treated embryos. Equatorial cryostat sections paralleling the blastodermal margin were used for immunostaining. See the above for other necessary information. (i–l) Changes in p-Smad1/5/8 distribution along the ventrodorsal axis in differently treated embryos. Embryos at the shield stage were immunostained using an anti-p-Smad1/5/8 antibody along with DAPI staining. The representative images were optical meridional sections by confocal microscopy with dorsal to the right. The dorsal region in i–k was enlarged in (i22–k22) respectively. The ratios of p-Smad1/5/8 to DAPI signals for indicated ventrodorsal regions of each group of embryos were shown in l. The ratio at each position was averaged from 3 to 5 embryos, 3–5 sections per embryos. The s.d. values were indicated. |
|
(a–d) chd mRNA expression detected by in situ hybridization in WT embryos at indicated stages. The shown were animal-pole views with dorsal to the right. (e–h) Chd protein distribution in WT embryos at different stages. Embryos were immunostained using an anti-Chd antibody and observed by confocal microscopy. Representative z-stack images were shown with dorsal to the right. The colour bar blow each picture illustrated signal level changes from ventral to dorsal with the ratio of Chd/DAPI at the two extremes indicated (also see Supplementary Fig. 2d). (i–k) Confocal images of Chd in different regions of embryos at the shield stages. Different regions boxed in g were viewed in an optical equatorial plane within the blastodermal margin. Note the presence of Chd in the ventralmost region (i). (l) Subcellular localization of Chd in embryos. A region boxed in g was enlarged. (m–p) Relationship between chd mRNA and Chd protein locations in embryos at the shield stage. Embryos were probed with antisense chd RNA probe and then immunostained using anti-Chd and anti-β-catenin antibodies along with DAPI staining. A representative embryo was observed under a confocal microscope in bright field (m) or in fluorescent field (n,o) with a focus plane at the blastodermal margin. In p, the confocal fluorescence image in n was superimposed on the bright/dark image in m. All images were orientated with dorsal to the right. The border of the chd mRNA area was labelled with a circle. |
|
(a–c) Chd protein distribution detected by confocal microscopy at different stages. Embryos injected with Tg(-2.067gsc:tBr-gfp) or Tg(-2.272bmp2b:tBr-gfp) DNA were harvested along with uninjected embryos at indicated stages for immunostaining using an anti-Chordin antibody and DAPI staining. Representative z-stack images were shown in animal-pole view with dorsal to the right. (d–g) The average ratios (e–g) of Chd to DAPI signals at the ventralmost or dorsalmost areas on optical equatorial sections at the blastodermal margin as illustrated in d. The strategy for estimating relative intensity was the same as described in the legend of Supplementary Fig. 2. For each group, the average relative immunostaining intensity was calculated from 3 to 5 embryos and three optical sections at and nearby the blastodermal margin per embryo. The error bars represented s.d. The Chd/DAPI ratio in the ventralmost region at each stage was set to 1.0. Statistical significance (Student’s t-test): NS, nonsignificant (P>0.05); *P<0.05; **P<0.01. (h–k) chd transcripts distribution detected by in situ hybridization at indicated stages. Representative embryos were animal-pole views with dorsal to the right. The ratio of embryos with representative pattern was indicated for those shown in h–j (l) The ratio of embryos showing an expansion of chd expression at the shield stage (as shown in k) n, number of observed embryos. |
|
(a) GFP expression driven by a chd promoter. Top panel illustrated structures of the chd locus and reporter constructs. TS, transcription start. Bottom panel showed gfp reporter expression in embryos at different stages with the ratio of indicated GFP-positive embryos. (b) Luciferase reporter expression driven by the chd promoter in Hep3B. The pGL3(-2.235chd:luc) construct was transfected alone or together with human Smad5, and relative luciferase activity was the mean from three experiments with s.d. indicated. Statistical significance (Student’s t-test): **P<0.01. (c) Effect of mutations in defined cis-elements on luciferase reporter expression. The top panel illustrated different constructs and the bottom panel showed luciferase reporter expression in Hep3B cells after transfection with reporter construct alone or together with Smad5. The average with s.d. was calculated from three independent experimental results. Statistical significance (Student’s t-test): *P<0.05; **P<0.01; NS, P>0.05. (d) Detection of Smad1 bound to chd promoter by using ChIP assay. On the top, illustration of the amplified Smad1-occupied region (SBEs) and a control region (Ctr) in chd locus; left panel in the bottom, ChIP-PCR results; bar graph in the bottom, quantification of the amplified SBEs fragment. The shown were the mean with s.d. from three experiments. |
|
(a) Representative morphology of different categories of live embryos at 24 h.p.f. after injection. Plasmid DNA was injected at doses: 105 pg for Tg(-2.067gsc:gfp), Tg(-2.067gsc:tBr-gfp) and Tg(-2.272bmp2b:tBr-gfp); 120 pg for the other constructs. (b) The ratio of embryos in different categories following injection of different plasmids. n, the number of observed embryos. (c) Marker expression detected by in situ hybridization at the shield stage. Embryos for flh and gsc were dorsally viewed and those for eve1 were viewed from the animal-pole with dorsal to the right. The ratio of embryos with the representative expression pattern was indicated. Amplified transgene DNA fragments from corresponding constructs were used for injection. (d) Quantification of marker expression domains. The angle for each marker, as depicted in the top of each bar graph, was measured and averaged with s.d. indicated (bottom). n, the number of observed embryos. Statistical significance (Student’s t-test): **P<0.01; ***P<0.0001. |
|
Effectiveness of anti-Bmp2b antibody for detection of endogenous Bmp2b in zebrafish embryos. (a-c′) Immunofluorescence detection of endogenous Bmp2b. Embryos were injected at the one-cell stage with 3 ng bmp2b-MO or 30 pg bmp2b mRNA and immunostained at the shield stage using anti-bmp2b antibody along with DAPI staining. All embryos were placed with animal pole to the top. Note that the signal was weakened in bmp2b morphant and greatly enhanced in bmp2b mRNA-injected embryo. (d) Bmp2b protein detection by western blotting. Embryos injected with 3 ng bmp2b-MO and uninjected embryos were harvested at the 75% epiboly stage and lysed for western blotting using anti-Bmp2b and anti-actin antibodies. Note that Bmp2b was reduced in bmp2b morphants. (e) Subcellular localization of Bmp2b proteins. A boxed area in the ventral region of the shield stage embryo (same one as shown in Fig. 1g) was enlarged in the middle picture and a single entire cell was further enlarged in the bottom picture. |
|
GFP or its fusion protein driven by a gsc promoter is specifically expressed in the organizer and its derivatives. (a) Illustration of the gsc locus and Tg(-2.067gsc:gfp) and Tg(-2.067gsc:tBr-gfp) transgene constructs. (b) Expression of the Tg(-2.067gsc:gfp) transgene in embryos. One-cell stage embryos were injected with 105 pg Tg(-2.067gsc:gfp) DNA and observed under a dissection fluorescence microscope at indicated stages. The showed were composite images by superimposing the fluorescence image on the bright field image of the same group of embryos. (c) Comparison of Tg(-2.067gsc:gfp) and Tg(-2.067gsc:tBr-gfp) expression at the shield stage. The showed were also composite images. Note that the embryo injected with Tg(-2.067gsc:tBr-gfp) was morphologically abnormal because of dorsalization. |
|
The 2.272-kb bmp2b promoter drives the expression of the reporter GFP in the dorsal side of embryos. (a) Illustration of the bmp2b locus and Tg(-2.272bmp2b:gfp) transgene construct. The plasmid construct -2.272bmp2b:gfp was made by placing gfp cDNA downstream of the 2.272-kb bmp2b promoter. (b, c) GFP expression in embryos at indicated stages following Tg(-2.272bmp2b:gfp) injection. Embryos at the one cell stage were injected with Tg(-2.272bmp2b:gfp) plasmid DNA at a dose of 50 pg per embryo and observed for GFP expression under a fluorescence dissection microscope at different stages. A group of embryos (b) or individual embryos (c) were showed. The composite pictures were made by superimposing the fluorescence image on the bright field image of the same field. Note that the reporter expression was restricted to the dorsal blastoderm at late blastulation stages and to the organizer and its derivatives at gastrulation stages but it did not occur in the ventral side. |
|
Bmp2b and p-Smad1/5/8 levels appear unaffected in earlier embryos depleted of organizer Bmp signals. One-cell embryos were injected with 105 pg Tg(-2.067gsc:tBr-gfp) or Tg(-2.272bmp2b:tBr-gfp) plasmid DNA and fixed at 40% and 55% epiboly stages. Uninjected or injected embryos were immunostained using anti-Bmp2b or anti-p-Smad1/5/8 antibody along with DAPI staining. The immunostained embryos were imaged by confocal microscopy from the animal pole. A series of optical equatorial sections at an interval of 3.5 μm were obtained, but only 2 or 3 sections at the blastodermal margin were used for intensity estimation. Eight areas on half of each section (as illustrated above curves), 323.28 μm2 each, were chosen to evaluate immunostaining intensity and DAPI intensity. For each group, 3-5 embryos were analyzed. The ratio of immunostaining intensity to DAPI represented relative immunostaining intensity, and the ratio in the ventralmost position was set to 1.0. (a-d) Representative confocal images and average relative immunostaining intensities. The standard deviations were indicated. |
|
Effectiveness of anti-Chordin antibody for detection of endogenous Chordin protein in zebrafish embryos. Uninjected or chd-MO-injected embryos at the shield stage were immunostained using anti-Chordin antibody along with DAPI staining. All embryos were viewed from the animal pole and placed with dorsal to the right. Note that Chd signals were dramatically reduced by knockdown of chd. |
|
Overexpression of cmbmp2b mRNA leads to embryonic dorsalization. Wild-type embryos were injected with 300 pg cmbmp2b mRNA at the one-cell stage and photographed at 30 hpf. Embryos were dorsalized to different degrees, suggesting that overexpression of cmbmp2b effectively interferes in Bmp signaling. The ratio of embryos with the representative morphology was indicated. |
|
Fine mapping of the chd promoter. (a) Illustration of reporter constructs carrying different lengths of the chd promoter. (b) Relative luciferase activity (RLA) in HEK293 cells transfected with different constructs. The control was transfection with the empty vector (pGL3) plasmid DNA. RLA was averaged from three independent experiments with SD indicated. (c) GFP expression in the organizer of shield stage embryos injected with different reporter constructs. (d, e) GFP expression in shield stage embryos injected with Tg(-0.235chd:gfp) alone or together with smad1-MO, Smad5-MO or both. Embryos were divided into 4 classes based on GFP intensity (d) and the ratio of embryos in each class was shown in (e). (f) Relative luciferase activity in Hep3B cells transfected with -0.235chd:luc reporter. The reporter was co-transfected with human Smad1 or Smad5. The empty vector pGL3 served as a control. Note that Smad5 transfection caused a significant reduction (p<0.05) of the reporter, but Smad1 transfection only led to a statistically nonsignificant reduction. |
|
Effects of Tg(-2.067gsc:tBr-gfp) on marker expression are partially counteracted by co-expression of Tg(-2.067gsc:bmp2b). Uninjected and injected embryos were examined at the shield stage for the expression of the dorsal markers gsc (a-c) and flh (e-g) and of the ventral marker eve1 (i-k). The ratio of embryos with altered marker expression was shown in bar graphs (d, h, l). |
|
Effect of co-depletion of chd and organizer Bmp signals on embryonic development. One-cell embryos were injected with 0.84 ng chd-MO alone or together with 105 pg Tg(-2.067gsc:tBr-gfp) plasmid DNA and observed for morphological changes at 26 hpf. (a) Representative embryos of different morphology categories. (b) The ratio of abnormal embryos. Note that inhibition of organizer Bmp signaling worsened ventralization of chd morphants. |
|
Comparison of bmp2b, bmp4 and bmp7a expression in zebrafish embryos at the shield stage. Wild-type embryos at the shield stage were examined for bmp2b, bmp4 and bmp7a expression by whole-mount in situ hybridization. Embryos were orientated with dorsal to the right. |
|
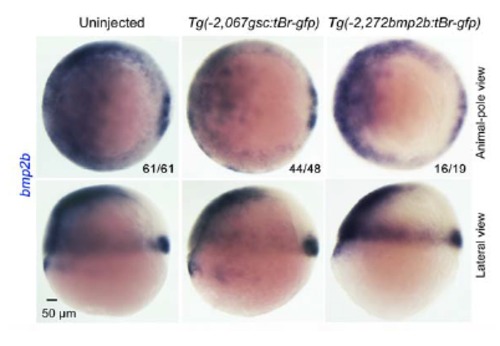
Transcription of bmp2b gene when organizer Bmp signaling is blocked. WT embryos at the one-cell stage were injected with 105 pg Tg(-2,067gsc:tBr-gfp) or Tg(-2,272bmp2b:tBr-gfp) DNA and harvested at the shield stage for examining bmp2b expression by in situ hybridization. The ratio of embryos with representative expression pattern was indicated. Embryos were orientated with dorsal to the right. Note that tBr-GFP overexpression led to a reduction of bmp2b expression in the ventral and lateral regions while its expression in the organizer appeared unaltered. |
|
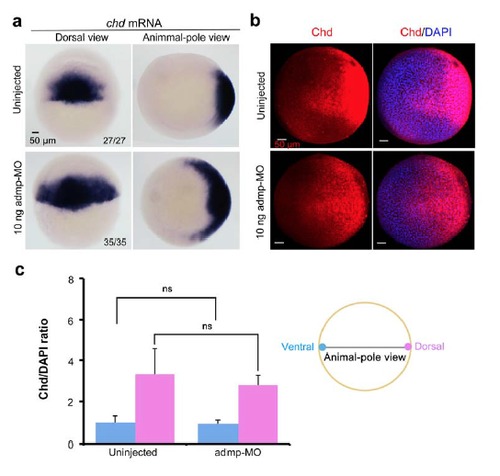
Effect of admp knockdown on Chd mRNA and protein distribution. (a) chd mRNA expression in uninjected or admp-MO-injected embryos at the shield stage as revealed by in situ hybridization. The ratio of embryos with expanded expression of chd was indicated. (b) Chd protein distribution in uninjected or admp-MO-injected embryos at the shield stage revealed by immunostaining with anti-Chordin antibody. The shown were confocal images in animal-pole view with dorsal to the right. (c) Comparison of relative Chd intensity. The ratio of Chd to DAPI signals in the ventralmost or dorsalmost area was calculated in a way similar to that described in Supplementary Fig. S5. The ratio in the ventralmost area in uninjected embryos was set to 1.0. |


