
- Title
-
Cadm4 Restricts the Production of Cardiac Outflow Tract Progenitor Cells
- Authors
- Zeng, X.X., Yelon, D.
- Source
- Full text @ Cell Rep.
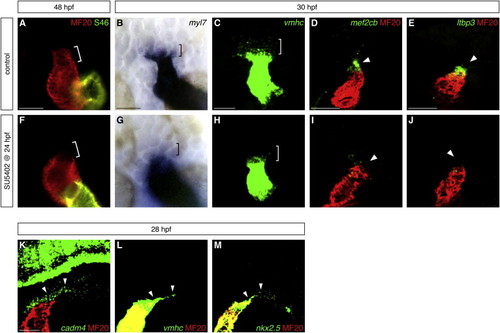
Fgf Signaling Promotes Formation of OFT Progenitor Cells (A and F) Hearts at 48 hpf, frontal views, arterial pole up, stained with MF20 (red) and S46 (green) antibodies to visualize the OFT (red, bracket), ventricle (red), and atrium (yellow). The OFT is morphologically evident in control DMSO-treated embryos (A) and absent in embryos treated with 10 μM SU5402 from 24 to 48 hpf (F). (B–E and G–J) In situ hybridization highlights the presumed OFT progenitor cells adjacent to the arterial pole at 30 hpf. Dorsal views (B, C, G, and H) and lateral views (D, E, I, and J), arterial pole up; (C–E and H–J) partial reconstructions of confocal z stacks. The presumed OFT progenitors (brackets) express low levels of myl7 (blue, B) and vmhc (green, C); very few of these cells are found in embryos treated with SU5402 from 24 to 30 hpf (G and H). Expression of mef2cb (green, D) and ltbp3 (green, E) is visible in the progenitor cells (arrowheads) residing next to the differentiated myocardium of the heart tube (MF20, red); this population is barely detectable in SU5402-treated embryos (I and J). (K–M) Fluorescent in situ hybridization shows that cadm4 (green, K) is expressed in the region where OFT progenitor cells are thought to reside (arrowheads), as well as in neuronal tissues as previously reported ( Pietri et al., 2008). vmhc (green, L) and nkx2.5 (green, M) are expressed at low levels within the same region (arrowheads), as well as at high levels throughout the heart tube. Differentiated myocardium is marked by MF20 (red); partial reconstructions of lateral views at 28 hpf. Scale bars, 50 μm. See also Figure S1 and Table S1. |
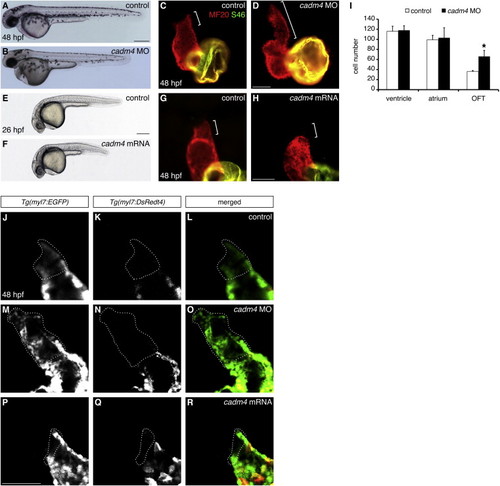
Cadm4 Activity Limits OFT Size (A–D) Reduced cadm4 function results in an enlarged OFT. (A and B) Lateral views of embryos at 48 hpf. Injection of an anti-cadm4 MO (B) does not disrupt general embryonic morphology. (C and D) Hearts at 48 hpf, as in Figure 1A. Compared with the normal length of the OFT (bracket, C) in control sibling embryos, the OFT in cadm4 morphants is abnormally elongated (bracket, D). (E–H) Elevated levels of cadm4 function result in reduced OFT size. (E and F) Lateral views of embryos at 26 hpf. Injection of cadm4 mRNA (F) causes slight shortening of the body axis. (G and H) Hearts at 48 hpf, as in (C). Rather than exhibiting normal OFT size (bracket, G), embryos injected with cadm4 mRNA exhibit very little OFT tissue (bracket, H). (I) Number of ventricular, atrial, and OFT CMs in control and cadm4 morphant hearts at 48 hpf; the graph displays mean and SD for each data set. Although the numbers of ventricular and atrial CMs are unaffected in cadm4 morphants, the OFT in cadm4 morphants has more CMs than the OFT in control siblings (p < 0.0005; n = 5). (J–R) Single confocal slices through Tg(myl7:EGFP);Tg(myl7:DsRedt4) hearts at 48 hpf, arterial pole up. These transgenes can distinguish early-differentiating CMs (EGFP and DsRed) from late-differentiating CMs (EGFP only, dotted outlines). Compared with controls (J–L), cadm4 morphants have an excess of late-differentiating CMs (M–O), and embryos injected with cadm4 mRNA have a deficit of late-differentiating CMs (P–R). Scale bars, 300 μm in (A) and (E), 50 μm in (D), (H), and (P). See also Figure S2 and Movies S1 and S2. |
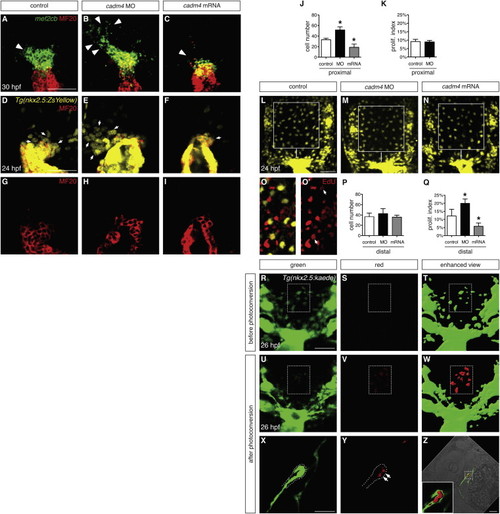
Cadm4 Limits Formation of OFT Progenitor Cells (A–C) In situ hybridization shows expression of mef2cb (green) in progenitor cells adjacent to the differentiated myocardium (MF20, red); partial reconstructions of dorsal views at 30 hpf, arterial pole up. In comparison with control embryos (A), this progenitor population (arrowheads) is expanded in cadm4 morphants (B) and reduced in embryos overexpressing cadm4 (C). (D–I) Partial reconstructions of dorsal views of arterial poles expressing Tg(nkx2.5:ZsYellow) (yellow, D–F) at 24 hpf; MF20 (red, D–I) marks differentiated CMs. In control embryos (D and G), undifferentiated progenitor cells (yellow, not red; arrows indicate examples) cluster in a proximal region adjacent to the arterial pole. This population is expanded in cadm4 morphants (E) and reduced in embryos overexpressing cadm4 (F). (J) Number of ZsYellow+MF20 OFT progenitor cells in the proximal region at 24 hpf in control embryos, cadm4 morphants, and embryos injected with cadm4 mRNA; asterisks indicate statistically significant differences from controls (p < 0.0001; n = 9–14). Comparable progenitor surpluses resulted from injection of either of two nonoverlapping MOs (52 ± 6 cells, ATG MO1 [n = 14]; 58 ± 6 cells, splice MO [n = 7]). (K) Proliferation indexes are comparable for the proximal OFT progenitor cells in control embryos and cadm4 morphants. (L–N) Partial reconstructions of dorsal views of the region near the arterial pole in embryos expressing Tg(nkx2.5:ZsYellow) at 24 hpf; images were captured with a higher gain than in (D)–(F). Squares indicate the region defined as distal in representative control (L), cadm4 morphant (M), and cadm4-overexpressing (N) embryos. (O and O’) EdU incorporation (red) in an embryo expressing Tg(nkx2.5:ZsYellow) (yellow); EdU is visible in at least two Tg(nkx2.5:ZsYellow)-expressing cells (arrows) in this representative slice. (P) The numbers of Tg(nkx2.5:ZsYellow)-expressing cells in the distal regions of control, cadm4 morphant, and cadm4-overexpressing embryos are similar (n = 7–12). (Q) The proliferation index is increased in the distal Tg(nkx2.5:ZsYellow)-expressing cells in cadm4 morphants (p < 0.0005) and is decreased in the same population in cadm4-overexpressing embryos (p < 0.0001). (R–W) Single slices show dorsal views near the arterial pole in a representative Tg(nkx2.5:kaede) embryo at 26 hpf, before (R–T) and after (U–W) photoconversion of a portion of the distal region (rectangle) containing approximately ten Tg(nkx2.5:kaede)-expressing cells (green in T, red in W). Enhanced views (T and W) were generated using the “surface” function in Imaris to highlight cells expressing low levels of Tg(nkx2.5:kaede). (X–Z) Single slices show lateral views of Tg(nkx2.5:kaede) expression in the heart at 30 hpf and indicate that three or four of the photoconverted cells (red, arrows) have become OFT CMs. Dots (X and Y) outline the ventral wall of the forming OFT. Bright-field image and magnified inset (Z) show the incorporation of red photoconverted cells within the green OFT myocardium. Similar results were obtained in four independent embryos. Bar graphs display mean and SD for each data set. Scale bars, 50 μm. See also Figures S2 and S3. |

Cadm4 Curtails Addition of Late-Differentiating Cells to the Arterial Pole (A–H) Expression of mef2cb (A, B, E, and F) and ltbp3 (C, D, G, and H) juxtaposed with staining of differentiated myocardium (as in Figures 1D and 1E) at 36 (A, C, E, and G) and 48 (B, D, F, and H) hpf; partial reconstructions (A, B, E, and F) or single slices (C, D, G, and H) of lateral views. (A–D) In control embryos, expression of both genes (arrowheads) becomes extinguished as OFT differentiation reaches completion. (E–H) In contrast, expression of both genes (arrowheads) is expanded and prolonged in cadm4 morphants. (I–N) Single slices of lateral views of Tg(myl7:kaede)-expressing hearts at 50 hpf, following photoconversion at 37 hpf. Comparison of green fluorescence (I and L) and red fluorescence (J and M) reveals the presence of late-differentiating cells (green, not red; dotted outlines). (I–K) Control embryos do not exhibit addition of late-differentiating cells between 37 and 50 hpf (n = 34). (L–N) In contrast, cadm4 morphants exhibit a population of green, but not red, OFT cells that initiated differentiation during this time frame (n = 42). Scale bars, 50 μm. See also Figure S4. |
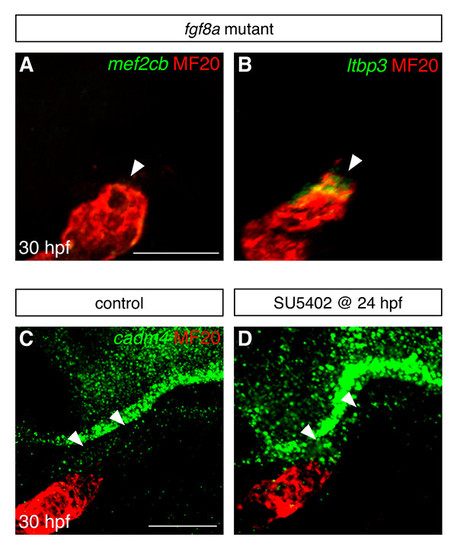
Fgf signaling influences gene expression in the vicinity of the arterial pole. (A,B) Fluorescent in situ hybridization examines expression of mef2cb (green, A) and ltbp3 (green, B) in the area adjacent to the arterial pole of the differentiated heart tube (MF20, red) at 30 hpf; images are partial confocal reconstructions. Embryos homozygous for a loss-of-function mutation in fgf8a (Reifers et al., 2000) display striking reductions in the expression of mef2cb (arrowhead, A) and ltbp3 (arrowhead, B), in comparison to the expression levels seen in wild-type embryos (compare with Fig. 1D,E). (C,D) Fluorescent in situ hybridization examines expression of cadm4 near the arterial pole of the ventricle (MF20, red) at 30 hpf; images are partial reconstructions of confocal z-stacks. In control DMSO-treated embryos at this stage, low levels of cadm4 expression are visible in the vicinity of the arterial pole (arrowheads, C). In contrast, embryos treated with 10 μM SU5402 from 24-30 hpf display heightened levels of cadm4 expression in this region (arrowheads, D). All images display lateral views, arterial pole up. Scale bars: 50 μm. EXPRESSION / LABELING:
|

Multiple anti-cadm4 MOs cause OFT elongation, and cadm4 plays a potent role in limiting the formation of Fgf-dependent OFT cells. (A-D) Hearts at 48 hpf, as in Fig. 1A. Compared to the OFT length in control embryos (bracket, A), embryos injected with any of three anti-cadm4 MOs exhibit OFT elongation (brackets, B-D). (E-G) Injection of a splice-blocking MO efficiently interferes with cadm4 splicing. Schematics (E,F) depict a portion of cadm4 pre-mRNA and mRNA. In contrast to normal splicing between exons 4 and 5 (E), embryos injected with the splice MO utilize a cryptic splice donor site, 66 bp upstream of the usual donor site (F). This alteration is predicted to remove 3 amino acids from the end of the second Ig-like domain and 19 amino acids from the region linking the second and third Ig-like domains. (G) The effectiveness of the splice MO is visualized by comparing RT-PCR amplification products using cDNA from control and splice MO-injected embryos. Primer pair F1R1 amplifies 517 bp of unspliced cadm4 pre-mRNA, and primer pair F1R2 amplifies 233 bp of normally spliced cadm4 mRNA or 167 bp of abnormally spliced cadm4 mRNA. An amplification product from the housekeeping gene gapdh is used as a control. (H-K, M-T) Partial reconstructions of Tg(myl7:EGFP);Tg(myl7:DsRedt4) hearts at 48 hpf, arterial pole up, distinguish early-differentiating and late-differentiating CMs, as in Fig. 2J-R. Spheres indicate late-differentiating CMs (green and not red) in (H) control embryos, (I) embryos treated with SU5402 from 24-48 hpf, (J) cadm4 morphants, and (K) cadm4 morphants treated with SU5402 from 24-48 hpf. (L) Number of late-differentiating CMs present at 48 hpf in control embryos (n=6), embryos treated with SU5402 from 24-48 hpf (n=9), cadm4 morphants (n=8), and cadm4 morphants treated with SU5402 from 24-48 hpf (n=9). Treatment of cadm4 morphants with SU5402 reduces the formation of late-differentiating CMs to a number similar to that seen in uninjected embryos treated with SU5402. Therefore, formation of excess late-differentiating OFT cells in cadm4 morphants is dependent upon Fgf signaling. (U-X) In situ hybridization depicts expression of ltbp3 (green) in progenitor cells adjacent to the differentiated myocardium (MF20, red); partial reconstructions of dorsal views at 28 hpf, arterial pole up. In comparison to control embryos (U), the ltbp3- expressing progenitor population is expanded in Tg(hsp70:ca-fgfr1) embryos (V) that experience increased Fgf signaling following heat shock at 22 hpf. In embryos overexpressing cadm4 (W), ltbp3 expression is reduced in a manner reminiscent of the effect of cadm4 overexpression on mef2cb expression (Fig. 3C). Expression of ltbp3 is similarly reduced in heat-shocked Tg(hsp70:ca-fgfr1) embryos that are also overexpressing cadm4 (X). Therefore, high levels of cadm4 activity can override the influence of elevated Fgf signaling on the OFT progenitor population. Scale bars: 50 μm. |

Cadm4 limits production of OFT progenitor cells but does not affect proliferation of OFT CMs. (A-D) In situ hybridization depicts expression of vmhc (A,B) and mef2cb (C,D) at 24 hpf; partial reconstructions of dorsal views, arterial pole up. In comparison to control embryos (A,C), cadm4 morphants exhibit expansion of the population of presumed OFT progenitor cells (B,D, arrows). (E-H) In situ hybridization depicts expression of mef2cb (E,F) and ltbp3 (G,H) at 24 hpf; partial reconstructions of lateral views, arterial pole up. Relative to control embryos (E,G), cadm4 morphants display expanded expression (arrows) of mef2cb (F) and ltbp3 (H) adjacent to the arterial pole. (I,J) EdU incorporation (red) in embryos expressing Tg(myl7:EGFP) (green) at 31 hpf, following EdU addition at 28 hpf; single confocal slices of dorsal views. No EdU incorporation was detected in CMs within the OFT (brackets) in control embryos (I; n=5). In cadm4 morphant embryos (J; n=6), EdU incorporation was detected in one OFT CM in one of the six embryos examined. In parallel experiments, we examined EdU incorporation in proximal OFT progenitor cells expressing low levels of Tg(myl7:EGFP) at 31 hpf, following EdU addition at 28 hpf; we found no significant difference in the proliferation index for this population between control embryos (17.6%+3.0%; n=3) and cadm4 morphants (14.3%+1.8%; n=4). (K-P) Single confocal slices of frontal views of Tg(myl7:EGFP);Tg(myl7:DsRedt4) hearts at 48 hpf, following EdU addition at 24 hpf. (K,L) EdU incorporation (red) is visible in DAPI-stained nuclei (blue). (M,N) EdU incorporation (red) is seen in some Tg(myl7:EGFP)-expressing CMs (green); arrows indicate the EdU-positive late differentiating CMs that do not express Tg(myl7:DsRedt4). (O,P) Expression of Tg(myl7:DsRedt4) (red) distinguishes early-differentiating and late-differentiating subsets of CMs, as in Fig. 2J-R. Control embryos (K,M,O) displayed EdU incorporation in 4±1 late-differentiating cells (n=10), whereas cadm4 morphant embryos displayed EdU incorporation in 8±2 late-differentiating cells (n=6). Thus, the number of proliferating OFT CMs appears proportional to the total number of OFT CMs in both cadm4 morphants and control siblings (Fig. 2I). Scale bars: 50 μm. |
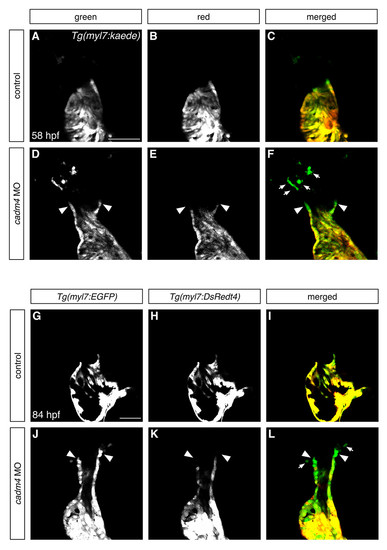
Cadm4 curtails the addition of latedifferentiating cells to the OFT. (A-F) Partial reconstructions of frontal views, arterial pole up, of Tg(myl7:kaede)- expressing hearts at 58 hpf, following photoconversion at 46 hpf. Comparison of green fluorescence (A,D) and red fluorescence (B,E) reveals the presence of latedifferentiating cells (green and not red). (A-C) Control embryos do not exhibit addition of late-differentiating cells between 46-58 hpf (n=14). (D-F) In contrast, all cadm4 morphants exhibit a population of OFT cells (arrowheads) that initiated differentiation during this timeframe (n=38/38), and many of the morphants (n=24/38) also possess a population of distal late-differentiating CMs that are not connected to the heart (arrows, F). (G-L) Single confocal slices through Tg(myl7:EGFP);Tg(myl7:DsRedt4) hearts at 84 hpf distinguish early-differentiating and late-differentiating CMs, as in Fig. 2J-R. cadm4 morphants (J-L) still exhibit a small group of late-differentiating CMs (arrowheads), whereas control siblings (G-I) do not (ne30). Also, similar to the results seen above (DF), many of the cadm4 morphants exhibit a population of late-differentiating CMs that are not directly connected to the heart (arrows, L). Scale bars: 50 μm. EXPRESSION / LABELING:
|