
- Title
-
Distinct Notch signaling outputs pattern the developing arterial system
- Authors
- Quillien, A., Moore, J.C., Shin, M., Siekmann, A.F., Smith, T., Pan, L., Moens, C.B., Parsons, M.J., Lawson, N.D.
- Source
- Full text @ Development
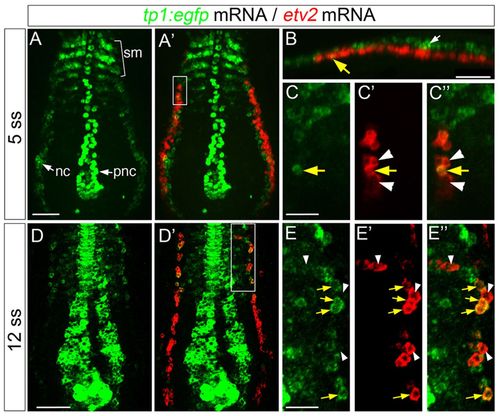
Notch signaling is active in early endothelial progenitors. (A-E) Confocal micrographs of flat-mounted Tg(tp1:egfp)um14 embryos following fluorescence in situ hybridization using riboprobes against egfp (green) and etv2 (red). (A,C-E) Dorsal views. (A-C) Images from the same embryo at 5 ss. (A,D) tp1:egfp expression; (A2,D2) tp1:egfp plus etv2 expression. (A) Arrows indicate neural crest (nc), proneural clusters (pnc); bracket denotes somitic mesoderm (sm). (B) Lateral view of embryo in A showing egfp expression in neural crest (white arrow), dorsal to etv2-expressing cells. The yellow arrow denotes the egfp/etv2-positive cell shown in C-C2 white arrowheads indicate the etv2-positive/egfp-negative cells. (C) Magnified area indicated by box in A2. (D,E) Images of the same embryo at 12 ss. (D2) Box indicates area magnified in E. (E) White arrowheads indicate etv2-positive/egfp-negative cells; yellow arrows denote egfp/etv2-coexpression. Scale bars: 100 μm (A,B,D); 40 μm (C,E). EXPRESSION / LABELING:
|

Notch activity increases and persists in arterial endothelial cells at later developmental stages. (A-D) Confocal micrographs of Tg(tp1:egfp)um14 embryos following fluorescence in situ hybridization using riboprobes against egfp (green) and fli1a (red). Lateral views, dorsal is up, anterior to the left. (A,C,D) White arrows denote dorsal aorta. (A) 16 ss embryo; the white box indicates the magnified area shown in B. (B) Yellow arrowheads and white arrows denote endothelial cells with high and low egfp expression, respectively. (C) Embryo at the 20 ss; the bracket with an asterisk in C2 shows area of mixed high- and low-expressing egfp-positive endothelial cells. (D) Embryo at 24 hpf. (E) Confocal micrograph of live Tg(fli1a:dsredex)um13;(tp1:egfp)um14 embryo at 7 days postfertilization showing Notch activation (green) and endothelial cells (red); DA, dorsal aorta; ISA, intersomitic artery; ISVe, intersomitic vein. Scale bars: 100 μm (A,C,D); 50 μm (B,E). EXPRESSION / LABELING:
|

Cells exhibiting early Notch activation contribute to the dorsal aorta. Lateral views, dorsal is up, anterior to the left. (A) Tg(tp1:creert2)jh12; (actb2:loxP-stop-loxP;nred)jh15 embryo at 48 hpf following exposure to tamoxifen at 5 ss for 1 hour. Left: differential interference contrast (DIC) image; middle: epifluorescence; right: overlay image. Yellow arrows denote presumptive endothelial cells lining the dorsal aorta (red bracket); blue arrowheads label non-fluorescent venous endothelial cells. (B) Two-photon microscopy of a Tg(tp1:creert2)jh12;(fli1ep:loxP-nblue-loxP;red)um43 embryo at 30 hpf following exposure to tamoxifen at 10 ss for 1 hour. Left: blue fluorescence in all endothelial nuclei; middle: red fluorescence in lineage traced endothelial cells; right: overlay. Arrow denotes red fluorescent endothelial cells in the dorsal aorta (DA); PCV, posterior cardinal vein. Scale bars: 50 μm. |

Multiple Notch receptors contribute to artery differentiation. (A,B) Confocal micrographs of flat-mounted sibling embryos at 10 ss following fluorescence in situ hybridization with riboprobes against egfp (green) and etv2 (red). Dorsal view, anterior is up. (A) Wild type Tg(tp1:egfp)um14; arrows indicate etv2/egfp double-positive cells. (B) Tg(tp1:egfp)um14;notch3fh332 mutant sibling. (C-F) DIC images of Tg(tp1:egfp)um14 wild-type (left panels) and notch3fh332 mutant (right panels) embryos at 24 hpf subjected to in situ hybridization with riboprobes against egfp (C,E) or efnb2a (D,F); (C,D) Embryos injected with 2.5 ng control morpholino (MO). (E,F) Embryos injected with 2.5 ng notch1b MO. Scale bars: 40 μm (A,B); 50 μm (C-F). EXPRESSION / LABELING:
|

deltac and dll4 have overlapping roles during artery differentiation. (A) Flat-mounted Tg(tp1:egfp)um14 embryo at 12 ss immunostained with antibodies against Deltac (red), Etv2 (magenta) and Egfp (green). Dorsal view, anterior is up. Box indicates magnified region in B. (B) White arrow denotes nucleus of Egfp-negative, Etv2-positive endothelial progenitor. Yellow arrows denote Etv2-positive nuclei of Egfp-positive cells. White arrowheads mark Deltac puncta adjacent to Egfp-positive endothelial cells. (C,D) Flat-mounted Tg(tp1:egfp)um14 embryos at 10 ss following two-color fluorescence in situ hybridization with riboprobes against egfp (green) and etv2 (red) imaged by confocal microscopy. Dorsal view, anterior is up. Yellow arrowheads denote etv2/egfp-positive cells; white arrows are etv2/egfp-negative cells. Embryos injected with 10 ng of control MO (C), or 10 ng of deltac MO (D). (E,F) DIC images of Tg(tp1:egfp)um14 embryos subjected to whole-mount in situ hybridization with riboprobes against efnb2a (left panels) or egfp (right panels). (E) Wild-type embryo injected with 15 ng control MO. (F) dlctit446 mutant embryo injected with 15 ng dll4 MO. Scale bars: 40 μm (A,C); 10 μm (B); 50 μm (E,F). EXPRESSION / LABELING:
|
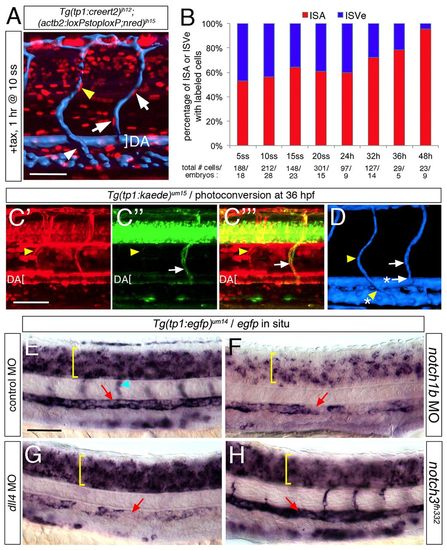
Notch is downregulated in ISVs during arteriovenous re-programming. (A) Two-photon imaging following microangiography (surface-rendered in blue) of Tg(tp1:creert2)jh12;(actb2:loxP-stop-loxP;nred)jh15 embryo at 60 hpf following exposure to tamoxifen at 10 ss for 1 hour. Yellow arrowhead denotes red endothelial nucleus lining an intersomitic vein, as determined by its connection to the posterior cardinal vein (white arrowhead). White arrows indicate cells lining an intersomitic artery connected to the dorsal aorta (indicated by white bracket). (B) Graph showing proportion of intersomitic arteries or veins with red fluorescent cells in Tg(tp1:creert2)jh12;(fli1ep:loxPnBlueloxP;red)um43 embryos at 60 hpf following a 1 hour tamoxifen pulse at the indicated stage; total numbers of labeled cells and embryos counted are indicated below the x-axis. (C,D) Two-photon micrographs of same Tg(tp1:kaede)um15 embryo at 60 hpf following photoconversion of Kaede at 36 hpf. Yellow arrowheads denote intersomitic vein endothelial cell positive for red, but not green fluorescence. White arrow denotes an intersomitic artery endothelial cell that maintained Kaede expression. (C) Red fluorescence indicating cells that exhibited Notch activation upon photoconversion at 36 hpf. (C2) Green fluorescence from Kaede expressed after photoconversion. (C2) Overlay of images in C and C2. (D) Surface rendering of image stack following microangiography of embryo in C; asterisked arrowhead and arrow denote connection to posterior cardinal vein and dorsal aorta, respectively. (E-H) Tg(tp1:egfp)um14 embryos at 30 hpf subjected to whole-mount in situ hybridization with an egfp riboprobe. Embryos injected with 2.5 ng of control MO (E), 2.5 ng of notch1b MO (F), 15 ng of dll4 MO (G) or mutant for notch3fh332 (H). Yellow bracket denotes neural tube, light blue arrowhead indicates the intersomitic vessels, and red arrow indicates the dorsal aorta. Scale bars: 50 μm. |

Notch activation in gata1a and cmyb expressing cells during somitogenesis. (A-E) Confocal images of embryos at indicated stages subjected to whole mount double fluorescent in situ hybridization with riboprobes against egfp (green) and (A-B) gata1a (red) or (C-D) cmyb (red). (A-D) Dorsal views of flat mounted embryos; anterior is up. (E) Lateral view, dorsal is up, anterior to the left. (A-E) Yellow arrows denote cells co-expressing gata1a or cmyb and egfp. White arrowheads denote cells expression only egfp. |

(A) DIC image of wild type embryo at 22 hours post fertilization (hpf) following whole mount in situ hybridization with a riboprobe against notch1a. White arrows indicate low level expression in presumptive endothelial cells in the dorsal aorta. (B) RT-PCR of a notch1b fragment spanning exon 8. The expected fragment size with normal splicing is approximately 600 bp, which is indicated on the marker lane. (C) Dorsal-lateral view of head region in a notch3fh332 mutant embryo injected with 2.5 ng notch1b MO. White arrows denote red blood cells that have leaked out of the cranial vessels indicative of hemorrhage. |

Multiple Notch receptors contribute to artery differentiation. (A-D) Tg(tp1:egfp)um14 embryos subjected to whole mount in situ hybridization with riboprobes against egfp (left panels) or efnb2a (right panels). Wild type embryos injected with (A) 2.5 ng control MO, (B) 1 ng notch1a MO or (C) 1 ng notch1a and 2.5 ng notch1b MO. (D) notch3fh332 mutant embryo injected with 1 ng notch1a MO. Red arrowheads denote dorsal aorta. EXPRESSION / LABELING:
|

Quantification of intersomitic artery (ISA) and vein (ISVe) connections. (A) Surface renderings of trunk blood vessel 2-photon micrographs following angiography with QDots. Dorsal aorta (DA) and posterior cardinal vein (PCV) denoted by brackets. Connection of an intersomitic vessel to the DA (white arrow; defined as an ISA) and PCV (light blue arrowhead; defined as an ISVe) are indicated in the first panel. (B) Graph showing average number of ISA and ISV connections per 10 vessels in embryos of indicated genotype, or injected with indicated Morpholino. Intersomitic vessels were quantified as arterial or venous based on circulation at 72 hpf in at least 10 embryos for each genotype or Morpholino injection. For Morpholino injections, embryos were injected with either 2.5 ng control or 2.5 ng notch1b Morpholino. PHENOTYPE:
|