
- Title
-
Proteomics analysis of the zebrafish skeletal extracellular matrix
- Authors
- Kessels, M.Y., Huitema, L.F., Boeren, S., Kranenbarg, S., Schulte-Merker, S., van Leeuwen, J.L., de Vries, S.C.
- Source
- Full text @ PLoS One
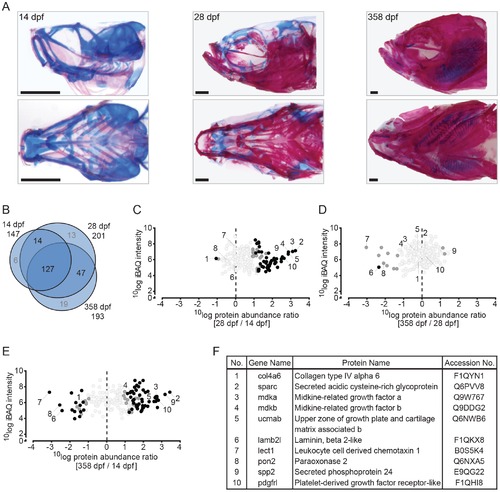
Quantitative analysis of the zebrafish craniofacial skeleton by MS-based proteomics. (A) Alcian blue/alizarin red stain of cartilage/bone structures in the craniofacial skeleton. Lateral (top) and ventral (bottom) images of all three time point used for protein extraction (left to right: 14 dpf, 28 dpf, 358 dpf). (B) VENN diagram of proteins selected for label-free quantification, with areas drawn to represent the number of proteins. Total number of proteins as well as distinct and common proteins are indicated for each time point. Proteins that did not qualify for label-free quantification are depicted in grey. (C-E) Ratio abundance plots showing log total iBAQ intensities versus log protein abundance ratio of the 28/14 dpf (C), the 358/28 dpf (D) and the 358/14 dpf (E) craniofacial skeleton ratios of all the proteins that met the strict criteria for label-free quantification (black circles, significantly differential abundant proteins at FDR = 0.01; dark grey circles, significantly differential abundant proteins at FDR = 0.05; light grey circles, no significant change in abundance). The numbers correspond to the proteins listed in 2F. (F) Table containing several of the significant differentially abundant proteins within the cranial skeleton. Specific proteins are discussed in the text. |
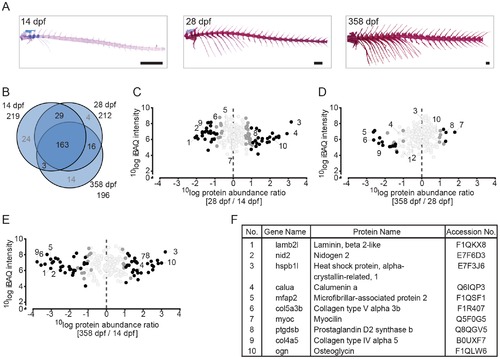
Quantitative analysis of the zebrafish axial skeleton by MS-based proteomics. (A) Alcian blue/alizarin red stain of cartilage/bone structures in the axial skeleton. Lateral images of all three time point used for protein extraction (left to right: 14 dpf, 28 dpf, 358 dpf). (B) VENN diagram of proteins selected for label-free quantification, with areas drawn to represent the number of proteins. Total number of proteins as well as distinct and common proteins are indicated for each time point. Proteins that did not qualify for label-free quantification are depicted in grey. (C-E) Ratio abundance plots showing log total iBAQ intensities versus log protein abundance ratio of the 28/14 dpf (C), the 358/28 dpf (D) and the 358/14 dpf (E) axial skeleton ratios of all the proteins that met the strict criteria for label-free quantification (black circles, significantly differential abundant proteins at FDR = 0.01; dark grey circles, significantly differential abundant proteins at FDR = 0.05; light grey circles, no significant change in abundance). The numbers correspond to the proteins listed in 3F. (F) Table containing several of the significant differentially abundant proteins within the axial skeleton. Specific proteins are discussed in the text. EXPRESSION / LABELING:
|
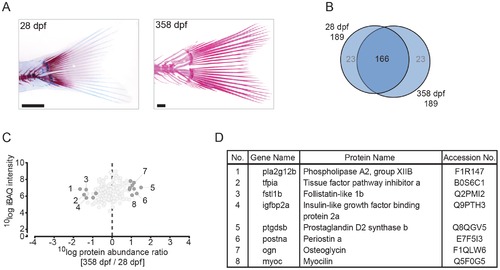
Quantitative analysis of the zebrafish caudal fin by MS-based proteomics. (A) Alcian blue/alizarin red stain of cartilage/bone structures in the caudal fin skeleton. Lateral images of two time points used for protein extraction (left to right: 28 dpf, 358 dpf). (B) VENN diagram of proteins selected for label-free quantification, with areas drawn to represent the number of proteins. Total number of proteins as well as distinct and common proteins are indicated for each time point. Proteins that did not qualify for label-free quantification are depicted in grey. (C) Ratio abundance plot showing log total iBAQ intensities versus log protein abundance ratio of the 358/28 dpf caudal fin region ratios of all the proteins that met the strict criteria for label-free quantification (dark grey circles, significantly differential abundant proteins at FDR = 0.05; light grey circles, no significant change in abundance). The numbers correspond to the proteins listed in 4D. (D) Table containing several of the significant differentially abundant proteins within the cranial skeleton. Specific proteins are discussed in the text. EXPRESSION / LABELING:
|
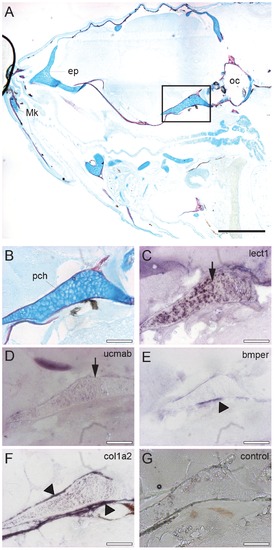
In situ mRNA hybridization of genes encoding extracellular proteins implicated in cartilage and bone formation in the head region. Sagittal sections of the head region of 28 dpf zebrafish juveniles stained by acid-free bone (red) and cartilage (blue) staining (A-B), or used for in situ hybridization with an antisense RNA probe corresponding to lect1 (C), ucmab (D), bmper (E), col1a2 (F). As a control, hybridization with the lect1 sense RNA probe is shown (G). (B-G) Magnification of boxed area in A focusing on the parachordal (pch) cartilage. Images are from consecutive sections at the same position. (C-D) Expression of lect1 and ucmab is located in chondrocytes of the parachordal (pch) cartilage (arrows). (E-F) Transcripts of bmper and col1a2 were detected in ossification sites surrounding the parachondral chondrocytes (arrow heads). Scale bars indicate 0.5 mm (black), or 100 µm (white). Abbreviations: ep, ethmoid plate; Mk, Meckel’s cartilage; oc, otic capsule; pch, parachordal. EXPRESSION / LABELING:
|
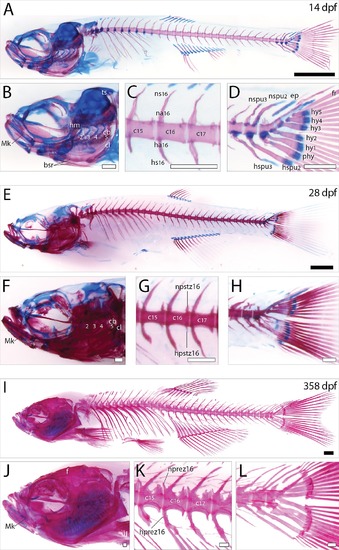
Histological analysis of the zebrafish larval, juvenile and adult skeleton. Lateral view of skeltal elements of (A-D) zebrafish larve, (E-H) juvenile, and (I-L) adult stage as revealed by acid-free bone and cartilage double staining. (B, F, J) Magnification of the zebrafish skull region. (C,G,K) Magnification of the first three caudal vertebrae. (D, H, L) Magnification of the caudal fin region. Scale bars indicate 1 mm (black), or 0.25 mm (white). Abbreviations: bsr, branchiostagel rays; cb, ceratobranchial; cl, cleithrum; ep, epural; f, frontal; fr, fin rays; ha, haemal arch; hm, hyomandibula; hprez, haemal prezygapophyses; hpstz, haemal postzygapophyses; hs, haemal spine; hspu, haemal spine of preural; hy, hypural; Mk, Merckel’s cartilage; na, neural arch; nprez, neural prezygapophyses; npstz, neural postzygapophyses; ns, neural spine; nspu, neural spine of preural; phy, parhypurals; ts, tectum synoticum. |