
- Title
-
prdm12b specifies the p1 progenitor domain and reveals a role for V1 interneurons in swim movements
- Authors
- Zannino, D.A., Downes, G.B., Sagerström, C.G.
- Source
- Full text @ Dev. Biol.
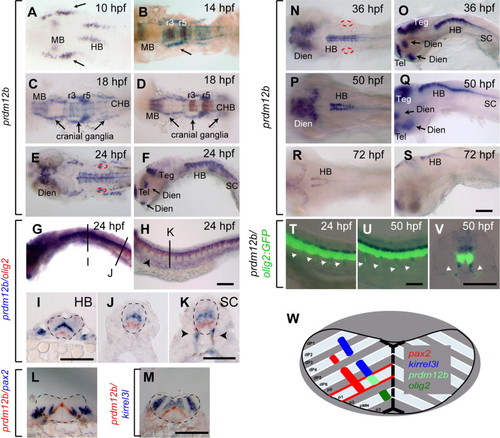
prdm12b is expressed in the p1 domain. (A–V). Expression of prdm12b by itself (A, C, E, F, N–S) and together with krox20 (B, D), olig2 (G–K), pax2 (L), kirrel3l (M) or olig2:egfp (T–V) in wild type embryos. Embryos are shown in dorsal (A–E, N, P, R) or lateral (F–H, O, Q, S–U) view with anterior to the left, or in cross section (I–M) with dorsal to the top. (W) Diagram of hindbrain gene expression. Scale bars are 100 μm, except (J–K, V) that are 50 µm. The otic vesicles and the neural tube are outline by red and black dashed lines, respectively. Arrows indicate cranial ganglia (A–D), or forebrain/midbrain structures (F, O, Q). Arrowheads mark motor axons (H, K, T–V). MB – midbrain, HB – hindbrain, CHB – caudal hindbrain, Teg – tegmentum, Dien – diencephalon, Tel – telencephalon, and r – rhombomere. EXPRESSION / LABELING:
|
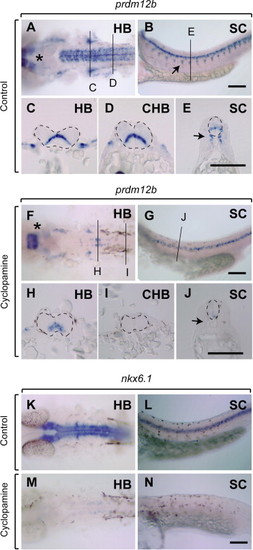
prdm12b is partially regulated by Shh. (A–N) prdm12b (A–J) or nkx6.1 (K–N) expression in control (A–E, K, L) or cyclopamine treated (F–J, M, N) embryos. Embryos are shown in dorsal (A, F, K, M) or lateral (B, G, L, N) view with anterior to the left, or in cross section (C–E, H–J) with dorsal to the top. Scale bars are 100 μm. Arrows indicate motor axons (B, E, J). Asterisk marks unaffected anterior prdm12b expression (A, F). HB – hindbrain, CHB – caudal hindbrain, and SC – spinal cord. |
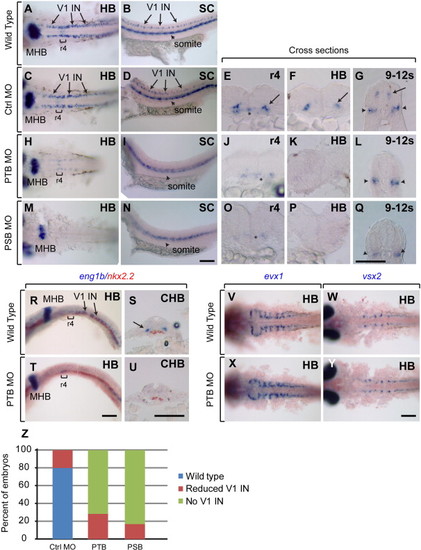
prdm12b is required for eng1b expression in the p1 domain. (A–Q) eng1b Expression in 24hpf wild type (A, B), control MO-injected (C–G), PTB MO-injected (H–L), PSB MO-injected (M–Q) embryos. (R–U) eng1b and nkx2.2 expression in 24 hpf wild type (R, S) and PTB MO-injected (T, U) embryos. (V, X) evx1 Expression in wild-type (V) and PTB MO-injected (X) embryos. (W, Y) vsx2 Expression in wild-type (W) and PTB MO-injected (Y) embryos. Embryos are shown in dorsal (A, C, H, M, V–Y) or lateral (B, D, I, N, R, T) view with anterior to the left, or in cross section (E–G, J–L, O–Q, S, U) with dorsal to the top. Sections were taken through r4, the hindbrain, the caudal hindbrain or the level of somites 9–12, as indicated. (Z) Quantification of eng1b phenotype. Scale bars are 100 μm. Brackets and asterisks indicate r4, arrows mark V1 interneurons and arrowheads mark somites. MHB – midbrain–hindbrain boundary, HB – hindbrain, CHB – caudal hindbrain, and SC – spinal cord. |
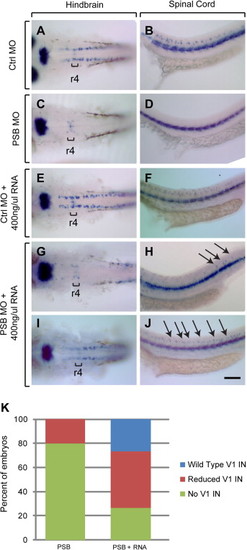
prdm12b mRNA rescues eng1b expression. (A–J) eng1b Expression in embryos injected with control MO (A, B), PSB MO (C, D), Ctrl MO+400 ng/μl RNA (E, F), or PSB MO+400 ng/μl RNA (I, J). (K) Quantification of rescue. Arrows indicate rescued V1 interneurons, brackets mark r4. Scale bars are 100 μm. |
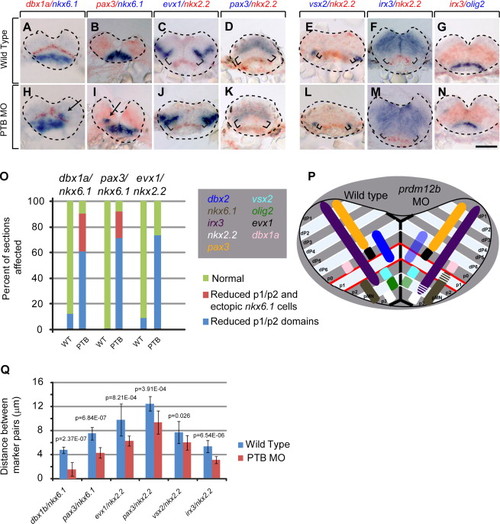
prdm12b Defines the dorsal boundary of nkx6.1 expression and regulates the size of the p1 domain. (A–N) Expression of dbx1a/nkx6.1 (A, H), pax3/nkx6.1 (B, I), evx1/nkx2.2 (C, J), pax3/nkx2.2 (D, K), vsx2/nkx2.2 (E, L), irx3/nkx2.2 (F, M) and irx3/olig2 (G, N) in wild-type (A–G) or PTB MO-injected (H–N) 24 hpf embryos. Panels represent cross sections through the hindbrain with dorsal to the top. (O) Quantification of dorsoventral patterning defects using ~100 sections from 16 embryos for each gene pair. (P) Diagram of dorsoventral gene expression in wild type (left half) and prdm12b MO-injected (right half) embryos. (Q) Quantification of the distance between various gene expression domains using 10 representative sections for each gene pair. Arrows indicate ectopic nkx6.1+ cells and brackets indicate unlabeled tissue between markers. Scale bar is 100 μm. |

Loss of prdm12b has a modest effect on hindbrain, but not spinal, motor neurons. (A–Q) Expression of Isl1/2 (A–D, K, L), olig2 (E–H), olig2:egfp (I, J), Isl1/2 together with hoxb1a:egfp (M, N) or Alcama (O–Q) in wild-type (A, C, E, F, I, K, M, O), PTB MO-injected (B, D, G, H, J, L, N, Q), or control MO-injected (P) embryos at 24 hpf (A–H) or 50 hpf (I–Q). Embryos are shown in lateral (A, B, I, J) or dorsal (C, D, K–Q) view with anterior to the left, or in cross section (E–H) with dorsal to the top. All scale bars are 35 μm, except I, J are 100 μm and E, H are 50 μm. RB – Rohon-Beard cells, MN – motor neurons, and (n)=cranial nerves. |

Loss of prdm12b has a transient effect on the number of OPC cells. (A–R, V–Y) Expression of olig2 (A–F), sox10 (G–L), dm20 (M–R), MBP (V, W) or fluoromyelin (X, Y) in wild type (A, B, G, H, M–O, V, X), control MO-injected (C, I), PTB MO-injected (D, E, J, K, P–R, W, Y) and PSB MO-injected (F, L) embryos. All embryos are in dorsal view with anterior to the left. Scale bars are 100 μm (A–R) or 35 μm (V–Y). Arrowheads indicate unaffected regions of sox10 expression, while arrows indicate affected regions. Red circles demark the otic vesicles. (S–U) Quantification of reduction in olig2 (S), sox10 (T) and dm20 (U) expression. |
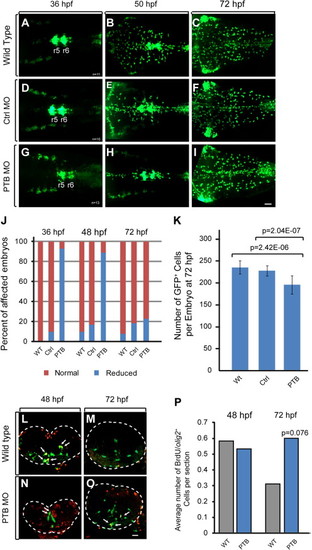
Increased replication of OPCs in prdm12b deficient embryos. (A–I) olig2:egfp Expression in wild type (A–C), control MO-injected (D–F), or PTB MO-injected (G–I) embryos. (J) Quantification of embryos with reduced numbers of olig2:egfp+ cells. (K) Quantification of olig2:egfp+ cells per embryo at 72 hp. (L–O) Cross sections of wild type (L, M) and PTB MO-injected (N, O) Tg(olig2:egfp) embryos labeled with anti-BrdU. (P) Quantification of the number of olig2:egfp+/BrdU+ cells per section. Scale bars are 35 μm (A–I) or 17 μm (L, M). The neural tube is outlined with dotted line in L, M. Arrows indicate olig2:egfp/BrdU double positive cells. EXPRESSION / LABELING:
PHENOTYPE:
|
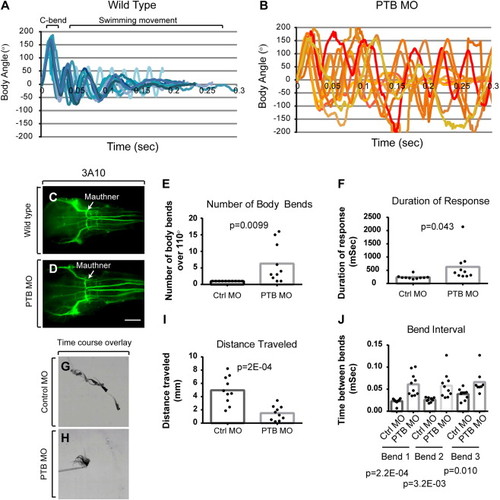
Fish lacking prdm12b function display an abnormal touch response. (A, B) Kinematic traces for 10 control MO-injected (A) and 10 PTB MO-injected (B) 4dpf fish from one of three separate experiments. Zero degrees on the y-axis indicate a straight body while positive and negative angles represent body bends in opposite directions. (C, D) Anti-3A10 labeling of Mauthner neurons in wild type (C) and PTB MO-injected (D) embryos in dorsal view. (E) Quantification of body bends with amplitude similar to the C-bend (defined as exceeding 110°). (F) Quantification of escape response duration in milliseconds. (G, H) Overlay of frames taken every 20 ms from a high-speed recording of a touch response in control MO-injected (G) and PTB MO-injected (H) fish. (I) Quantification of distance traveled during the escape response. (J) Quantification of time interval between the first and second bend (bend 1), second and third bend (bend 2), third and fourth bend (bend 3) during the escape response. |

The PTB-MO blocks Prdm12b translation and disrupts eng1b expression. (A) Expression of eng1b and krox20 in 24 hpf wild type embryo. (B) Morpholino-mediated knockdown of Prdm12b translation. In vitro translation reactions were resolved by PAGE, Western blotted and biotinylated Prdm12b was detected using avidin-alkaline phosphatase (bottom panel). Ponseau S staining (top panel) was used to demonstrate even loading of samples. (C, D) eng1b Expression in 50 hpf wild type (C) and PTB MO-injected (D) embryos. All embryos are in dorsal views with anterior to the left. Scale bar is 10 μm. |
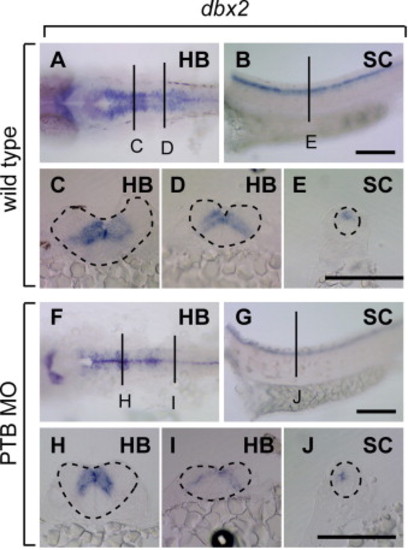
dbx2 Expression is mildly reduced in prdm12b deficient embryos. (A–J) Expression of dbx2 in wild type (A–E) and PTB MO-injected (F–J) embryos. Embryos are shown in dorsal (A, F) or lateral (B, G) view with anterior to the left, or in cross section (C–E, H–J) with dorsal to the top. Scale bars are 10 μm. HB – hindbrain and SC – spinal cord. |
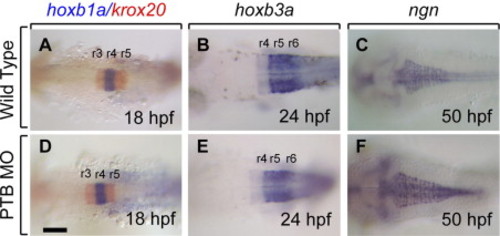
Anterioposterior patterning is unaffected in prdm12b deficient embryos. (A–F) Expression of hoxb1a/krox20 (A, D), hoxb3a (B, E) and ngn (C, F) in wild-type (A–C) and PTB MO-injected (D–F). All embryos are in dorsal views with anterior to the top. Scale bar is 10 μm. |
Reprinted from Developmental Biology, 390, Zannino, D.A., Downes, G.B., Sagerström, C.G., prdm12b specifies the p1 progenitor domain and reveals a role for V1 interneurons in swim movements, 247-60, Copyright (2014) with permission from Elsevier. Full text @ Dev. Biol.