
- Title
-
Local caspase activation interacts with Slit-Robo signaling to restrict axonal arborization
- Authors
- Campbell, D.S., and Okamoto, H.
- Source
- Full text @ J. Cell Biol.
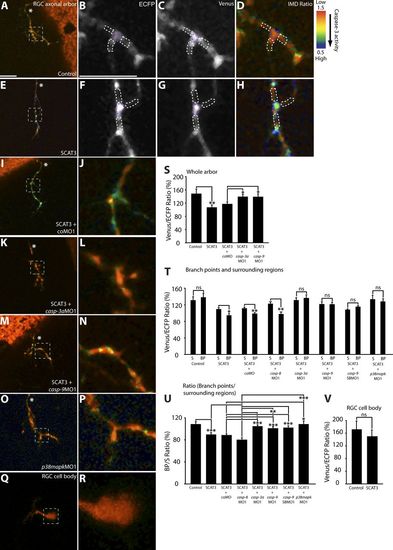
Local caspase activation at branch points in young RGC arbors. (A, D, E, and H–R) Representative IMD ratio images of 80-hpf live RGC arbors in the optic tectum (A, D, E, and H–P) and an RGC cell body (Q and R) in the retina. Caspase activation is represented by the pseudocolors that correspond to the Venus/ECFP ratio (1.5–0.5). Red represents low caspase activation, and violet represents high caspase activation. (A, D, E, and H–P) Control (A and D), SCAT3 (E and H), SCAT3 + coMO (I and J), SCAT3 + casp-3aMO1 (K and L), SCAT3 + casp-9MO1 (M and N), and SCAT3 + p38mapkMO1 (O and P) are shown. (B–D and G) ECFP channel (B and D) and Venus channel (C and G) of SCAT3- and control-expressing arbors are also shown. The region enclosed by the dashed squares in A, E, I, K, M, O, and Q are magnified in B–D, F–H, J, L, N, P, and R. (S) Quantification of Venus/ECFP ratios across the whole arbor. Branch points were determined as covering a distance of 1 μm or less away from where a branch tip joins an arbor. Surrounding regions were determined at a distance of 1 μm away from a branch tip and 2 μm in length, covering the width of the branches. (B–D and F–H) Examples illustrating regions of interest for the quantification of the Venus/ECFP ratio at branch points (purple dashed areas) and surrounding regions (white dashed areas) for control- and SCAT3-expressing arbors, respectively. (T) Quantification of Venus/ECFP ratios at branch points (BP) and surrounding regions (S). (U and V) Presented as a ratio of branch points/surrounding regions (U) and RGC cell bodies (V). White asterisks indicate the parent axon. 19–28 RGC arbors were analyzed in S. 29–36 branch points and 87–108 surrounding regions were analyzed in T and U. 15–16 RGC cell bodies were analyzed in V. Error bars represent SEMs. *, P < 0.05; **, P < 0.01; ***, P < 0.001. Bars, 10 μm. The image in E of a SCAT3-expressing arbor is shown again in Figs. 5 A and S2 C. The magnified image in H also is shown again in Fig. 5 B. PHENOTYPE:
|
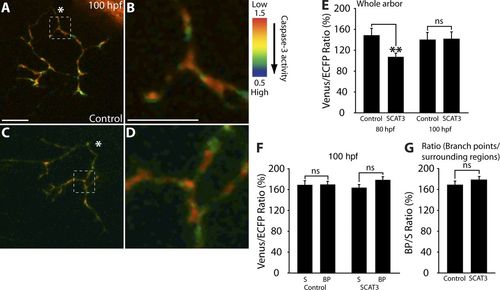
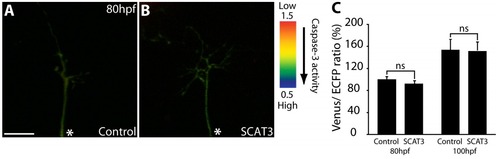
Caspase activity is undetectable in older RGC arbors. (A–D) Representative IMD ratio images of 100-hpf live RGC arbors in the optic tectum; caspase activation is represented by the pseudocolors that correspond to the Venus/ECFP ratio (1.5–0.5). Red represents low caspase activation and violet represents high caspase activation. (A–D) Control (A and B) and SCAT3 (C and D) images are presented. The region enclosed by the dashed squares in A and C are magnified in B and D. (E–G) Quantification of Venus/ECFP ratios across the whole arbor for both 80-hpf (E; data as in Fig. 1 S) and 100-hpf (F) arbors at branch points (BP) and surrounding regions (S) presented as a ratio of branch points/surrounding regions (G). White asterisks indicate the parent axon. Dorsal views are shown, and anterior is up. 10–12 RGC arbors were analyzed per condition. Error bars represent SEMs. **, P < 0.01. Bars, 10 μm. |

Caspase activity rapidly increases upon young RGC arbor branch tip formation. (A) Imaging analysis scheme for 80-hpf arbors expressing SCAT3-forming branches during the 5-min imaging interval. Branch points were determined as covering a distance of 2 μm or less away from where a branch tip joins, and arbor nonbranch points were 5–20 μm away from a branch tip and 3 μm in length, covering the width of the branches as for surrounding regions (Fig. 1). (B–E) Representative IMD images of an 80-hpf RGC arbor expressing SCAT3. Caspase activation is represented by the pseudocolors that correspond to the Venus/ECFP ratio 1.5–0.5 or 1.0–0.5. Red represents low caspase activation, and violet represents high caspase activation. (B–D) 5 min before branch point formation (BP T 5 min; B) and after branch tip (BP) formation (C). The region enclosed by the dashed squares in B and C are magnified in D and E. (F and G) Quantification of the Venus/ECFP ratio (F) comparing changes in arbors between regions that do or do not lead to the formation of branch points as in the scheme in A and presented as ratios (G). (H) Imaging analysis scheme for 100-hpf arbors expressing SCAT3 that are stable during the 5-min imaging interval. (I–L) Representative IMD images of a 100-hpf RGC arbor expressing SCAT3 that possesses branch points (BP T0; I), which remain stable during the 5-min imaging interval (BP T + 5 min; J). The regions enclosed by the dashed squares in I and J are magnified in K and L. (M and N) Quantification of the Venus/ECFP ratio (M) comparing changes in arbors between stable branch tips and regions that do not form branch tips as in the scheme in H and presented as ratios (N). White arrowheads depict the region in D that will become a branch point in E. White asterisks indicate the parent axon. 37 branch point additions and nonbranch points in six arbors were analyzed for 80-hpf arbors. 30 stable branch points from seven arbors were analyzed for 100-hpf arbors. Dorsal views are shown, and anterior is up. Error bars represent SEMs. ***, P < 0.001. Bars, 10 μm. |
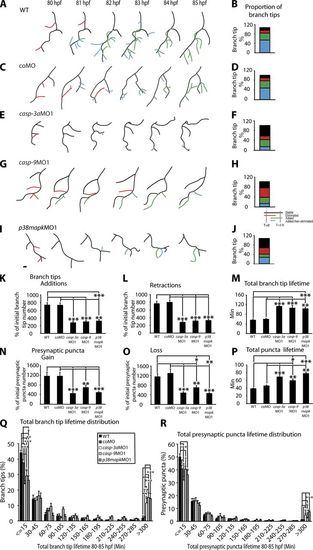
Capase-3, Caspase-9, and p38 MAPK promote RGC axon arbor dynamics. (A, C, E, G, and I) Tracings of arbors at 80–85 hpf expressing YFP-Rab3. Images represent WT (A), coMO (C), casp-3aMO1 (E), casp-9MO1 (G), and p38mapkMO1 (I) morphant arbors every hour during a 5-h time-lapse imaging. All show dorsal views. Black, stable branch tips; red, eliminated tips; green, added tips; blue, tips that were added then eliminated during imaging. (B, D, F, H, and J). The proportion of branch tips in each category. These graphs are derived from analysis of a single arbor in a single experiment. (K and L) Branch tip additions (K) and retractions (L) are shown in the graphs. (N and O) Presynaptic puncta gain (N) and loss (O) are presented as a percentage of initial branch tip or presynaptic puncta, respectively. (M and P) Total branch tip (M) and presynaptic puncta lifetimes (P) include all branch tips or presynaptic puncta present at one or more time points. (Q and R) Total branch tip (Q) and presynaptic puncta lifetime distribution (R) are shown. 9–13 RGC arbors were analyzed per condition. Tracings are dorsal views; anterior is up. Error bars represent SEMs. *, P < 0.05; **, P < 0.01; ***, P < 0.001. Bar, 10 μm. PHENOTYPE:
|
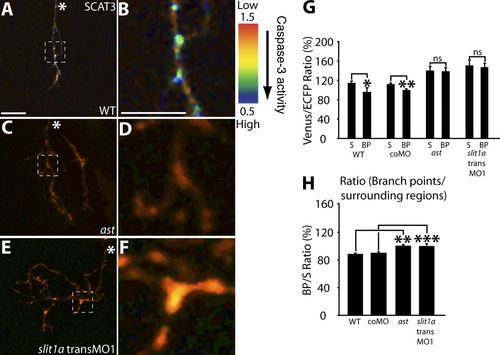
Caspase activation is reduced in RGC arbors with impaired Slit1a-Robo2 signaling. (A–F) Representative IMD ratio images of 80-hpf live RGC arbors in the optic tectum expressing SCAT3. Caspase activation is represented by the pseudocolors that correspond to the Venus/ECFP ratio (1.5–0.5). Red represents low caspase activation, and violet represents high caspase activation. WT (A and B), ast (C and D), and slit1a transMO1 (E and F) are shown. The regions enclosed by the dashed squares in A, C, and E are magnified in B, D, and F. (G and H) Quantification of Venus/ECFP ratios (G) at branch points (BP) and surrounding regions (S) presented as a ratio of branch points/surrounding regions (H). White asterisks indicate the parent axon. 15–35 branch points and 45–105 surrounding areas were analyzed per condition. Dorsal views are shown, and anterior is up. Error bars represent SEMs. *, P < 0.05; **, P < 0.01; ***, P < 0.001. Bars, 10 μm. The image in A of a SCAT3-expressing arbor is shown again in Figs. 1 E and S2 C. The magnified image in B also is shown again in Fig. 1 H. PHENOTYPE:
|
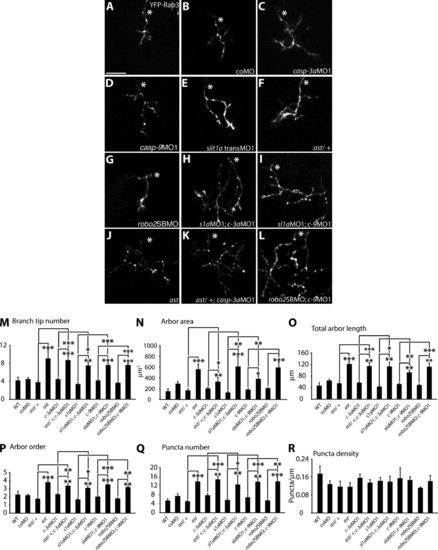
Caspases-3 and -9 interact with Slit1a-Robo2 signaling to restrict arbor size. (A–L) Maximum intensity projections of 80-hpf RGC arbors in the optic tectum expressing YFP-Rab3. WT (A), coMO (B), casp-3aMO1 (C), casp-9MO1 (D), slit1a transMO1 (low dose; E), ast/+ (F), robo2SBMO1 (low dose; G), slit1a transMO1 (low dose); casp-3aMO1 (H), slit1a transMO1 (low dose; I), ast (J), ast/+; casp-3aMO1 (K), and robo2SBMO1 (low dose); casp-9MO1 (L) are shown. (M–R) Quantification of arbor parameters: branch tip number (M), arbor area (N), total arbor length (O), arbor order (P), presynaptic puncta number (Q), and puncta density (R). 7–15 arbors were analyzed per condition. Part of the ast data is obtained from Campbell et al. (2007). Dorsal views are shown, and anterior is up. White asterisks indicate the parent axon. Error bars represent SEMs. *, P < 0.05; **, P < 0.01; ***, P < 0.001. Bar, 10 μm. PHENOTYPE:
|

p38 MAPK interacts with Slit1a-Robo2 signaling to restrict arbor and presynaptic growth. (A–F) Maximum intensity projections of 80-hpf RGC arbors in the optic tectum expressing YFP-Rab3. coMO (A), p38mapkMO1 (B), slit1a transMO1 (low dose; C), robo2SBMO1 (low dose; D), p38mapkMO1; slit1a transMO1 (low dose; E), and p38mapkMO1; robo2SBMO1 (low dose; F). (G–L) Quantification of arbor parameters: branch tip number (G), arbor area (H), total arbor length (I), arbor order (J), presynaptic puncta number (K), and puncta density (L). 6–20 arbors were analyzed per condition. Dorsal views are shown, and anterior is up. White asterisks indicate the parent axon. Error bars represent SEMs. *, P < 0.05; **, P < 0.01; ***, P < 0.001. Bar, 10 μm. PHENOTYPE:
|

Caspase-3 interacts with Slit1a-Robo2 signaling to promote arbor dynamics. (A, C, E, G, and I) Tracings of arbors at 80–85 hpf expressing YFP-Rab3 for slit1a transMO1 (low dose; A), robo2SBMO (low dose; C), casp-3aMO1 (low dose; E), slit1a transMO1 (low dose); casp-3aMO1 (lose dose; G), and robo2SBMO (low dose); casp-3aMO1 (low dose; I) morphant arbors every hour during a 5-h time-lapse imaging. Dorsal views are shown. Black, stable branch tips; red, eliminated tips; green, added tips; blue, tips that were added then eliminated during imaging. (B, D, F, H, and J) The proportion of branch tips in each category. These graphs are derived from analysis of a single arbor in a single experiment. (K, L, O, and P) Branch tip additions (K), retractions (L), presynaptic puncta gain (O), and puncta loss (P) are presented as percentages of initial branch tip or puncta number. (M and N) Total branch tip lifetime (M) and the percentage of branch tips present throughout the imaging period (N). (Q and R) Total puncta lifetime (Q) and the percentage of puncta present throughout the imaging period (R). A minimum of five RGC arbors were analyzed per condition. Dorsal views are shown, and anterior is up. Error bars represent SEMs. *, P < 0.05; **, P < 0.01; ***, P < 0.001. Bar, 10 μm. PHENOTYPE:
|
|
Dynamics of caspase activity in young RGC arbors. WT 80–85-hpf RGC arbor expressing SCAT3. Imaging is every 5 min for 2 h. Live imaging was performed on an inverted confocal microscope (FV1000D). Caspase activation is represented by the pseudocolors that correspond to the Venus/ECFP ratio (1.5–0.5). Red represents low caspase activation, and violet epresents high caspase activation. White arrowhead indicates the new branch tip forming shown in Fig. 3 (B–E). |
|
Dynamics of caspase activity in older RGC arbors. WT 100–105-hpf RGC arbor expressing SCAT3. Imaging is every 5 min for 1 h and 45 min. Live imaging was performed on an inverted confocal microscope (FV1000D). Caspase activation is represented by the pseudocolors that correspond to the Venus/ECFP ratio (1.5–0.5). Red represents low caspase activation, and violet represents high caspase activation. |
|
WT arbors are highly dynamic. WT 80–85-hpf RGC arbor expressing YFP-Rab3. Imaging is every 15 min for 5 h. Live imaging was performed on an upright confocal microscope (LSM 510 META). |
|
coMO RGC arbors are highly dynamic. coMO 80–85-hpf RGC arbor expressing YFP-Rab3. Imaging is every 15 min for 5 h. Live imaging was performed on an upright confocal microscope (LSM 510 META). |
|
casp-3a knockdown leads to more stable RGC arbors. casp-3aMO1 80–85-hpf RGC arbor expressing YFP-Rab3. Imaging is every 15 min for 5 h. Live imaging was performed on an upright confocal microscope (LSM 510 META). |
|
casp-9 knockdown leads to more stable RGC arbors. casp-9MO1 80–85-hpf RGC arbor expressing YFP-Rab3. Imaging is every 15 min for 5 h. Live imaging was performed on an upright confocal microscope (LSM 510 META). |
|
p38mapk knockdown leads to more stable RGC arbors. p38mapkMO1 80–85-hpf RGC arbor expressing YFP-Rab3. Imaging is every 15 min for 5 h. Live imaging was performed on an upright confocal microscope (FV1000D). |
|
Low dose MO against casp-3a does not affect arbor dynamics. Low dose casp-3MO1 80–85-hpf RGC arbor expressing YFP-Rab3. Imaging is every 15 min for 5 h. Live imaging was performed on an upright confocal microscope (LSM 510 META). |
|
Low dose MO against slit1a does not affect arbor dynamics. Low dose slit1a transMO1 80–85-hpf RGC arbor expressing YFP-Rab3. Imaging is every 15 min for 5 h. Live imaging was performed on an upright confocal microscope (LSM 510 META). |
|
A combination of low dose casp-3aMO1 and low dose slit1a transMO1 leads to more stable arbors. Low dose casp-3aMO1 and slit1a transMO1 80–85-hpf RGC arbor expressing YFP-Rab3. Imaging is every 15 min for 5 h. Live imaging was performed on an upright confocal microscope (LSM 510 META). |

Zebrafish casp-3a, casp-8, and casp-9 are expressed in the eye and optic tectum during RGC arborization and synaptogenesis. (A–H) Transverse sections of the retina (A, C, E, and G; dorsal is up) and tectum (B, D, F and H; dorsal is up) at 80 hpf. (A–F) casp-3a, casp-8, and casp-9 are expressed in the RGC layer of the retina and tectum. G and H) casp-8 sense RNA control. RGC, retinal ganglion cells; IPL, inner plexiform layer; INL, inner nuclear layer; Tec, tectum. Bars, 50 μm. EXPRESSION / LABELING:
|

SCAT3 reports Caspase-3 activation. (A–C) RGC arbor expressing SCAT3 showing ECFP channel (A), Venus channel (B), and IMD ratio images (C). Caspase activation is represented by the pseudocolors that correspond to the Venus/ECFP ratio (1.5–0.5). Red represents low caspase μmactivation, and violet represents high caspase activation. (D) Quantification of arbor parameters on the Venus channel as a percentage of the IMD ratio image. SCAT3 is activated upon Caspase-3 activation. (E–H) Representative IMD ratio images of 80-hpf live tectal cell bodies. (E–H) SCAT3 (E and F) and control (G and H), before (T0; E and G) and after (F and H) the application of PAC-1 (3 h). (O and P). Quantification of Venus/ECFP ratios. 22–33 tectal cells were analyzed per condition. Dorsal views are shown, and anterior is up. Acceptor photobleaching indicates that FRET occurs between the ECFP and Venus moieties of SCAT3. (I–L) Representative IMD ratio images of 80-hpf live RGC arbors. SCAT3 (I and J), control (K and L), and tectal cell body (M and N) expressing SCAT3, before (SCAT3 T0; I, K, and M) and after (J, K, and N) 5-min photobleaching with a 514-nm laser (SCAT 3 514 nm 5 min). (O–S) Quantification of Venus/ECFP ratios across whole arbors or tectal cells. (A–C and I–L) White asterisks indicate the parent axon of RGC arbors. (E–H, M, and N) White asterisks indicate the primary dendrite of tectal cells. Five RGC arbors and 11 tectal cell bodies were analyzed per condition. Error bars represent SEMs. **, P < 0.01; ***, P < 0.001. Bars, 10 μm. The images in A–C of a SCAT3-expressing arbor are shown again in Figs. 1 E and 5 A. |
Caspase activation is undetectable in tectal dendritic arbors. (A and B) Representative IMD ratio images of 80-hpf live tectal dendrites. Caspase activation is represented by the pseudocolors that correspond to Venus/ECFP ratio (1.5–0.5). Red represents low caspase activation, and violet represents high caspase activation. Control (A) and SCAT3 (B) images are shown. (C) Quantification of Venus/ECFP ratios for 80-hpf and 100-hpf tectal dendrites. Dorsal views are shown. White asterisks indicate the primary dendrite. 5–16 tectal dendrites were analyzed per condition. Error bars represent SEMs. Bar, 10 μm. |

Caspase activity may remain lower after branch tip retraction. (A) Imaging analysis scheme for 80-hpf arbors expressing SCAT3 undergoing branch tip retractions during the 5-min imaging interval. (B–E) Representative IMD images of an RGC arbor expressing SCAT3. Caspase activation is represented by the pseudocolors that correspond to the Venus/ECFP ratio (1.5–0.5). Red represents low caspase activation, and violet represents high caspase activation 5 min before branch tip retraction (BP T0; B) and after branch tip retraction (BP retraction [Ret] T + 5 min; C). The region enclosed by the dashed squares in B and C are magnified in D and E. (F–H) Quantification of the Venus/ECFP ratio (F) comparing changes in arbors between regions that do or do not lead to branch tip retraction as in the scheme in A and presented as ratios (G and H). (H) There was a significant difference in the ratios between recent branch point (BP) additions (data from Fig. 3 G and BP Ret T + 5 min), suggesting that caspase activation may be lower after branch tip retractions. μmWhite arrowheads depict the region, which undergoes branch tip retraction. Dorsal views are shown, and anterior is up. White asterisks indicate the parent axon. 23 branch point retractions and nonbranch points in five arbors were analyzed. Error bars represent SEMs. **, P < 0.01. Bars, 10 μm. |

casp-3aMO1 and casp-9MO1 morphants do not have increased apoptosis, and RGC axons follow normal trajectories to the optic tectum. (A–F) Lateral views of TUNEL labeling of WT (A), coMO (B), HA14-1 (activates Caspase-3 by the inhibition of Bcl-2, positive control; C), control (vehicle, Milli-Q water; D), casp-3aMO1 (E), and casp-9MO1 (F) at 80 hpf. No increase in apoptosis is observed in the morphants. (G–J) Lateral views of WT (G), coMO (H), casp-3aMO1 (I), and casp-9MO1 (J) morphants at 80 hpf, illustrating the pathway taken by one or a few YFP-Rab3–labeled RGCs from the optic chiasm to the tectum. Those morphant RGC axons that reach the tectum follow a normal trajectory. n = 5 embryos analyzed per condition. Tec, tectum. Anterior is left, and dorsal is up. Bar, 100 μm. PHENOTYPE:
|