
- Title
-
Autophagy is required for zebrafish caudal fin regeneration
- Authors
- Varga, M., Sass, M., Papp, D., Takács-Vellai, K., Kobolak, J., Dinnyés, A., Klionsky, D.J., and Vellai, T.
- Source
- Full text @ Cell Death Differ.
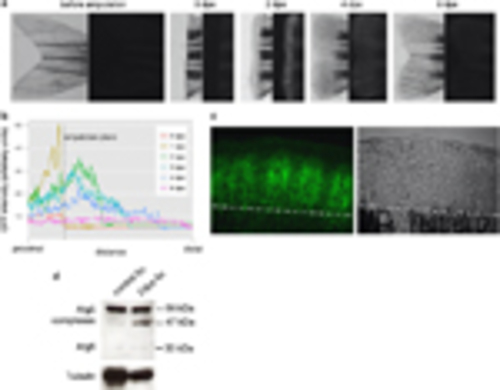
Autophagy is upregulated during zebrafish caudal fin regeneration. (a) Intense accumulation of the autophagy marker Lc3Atg8 in the blastema tissue. Expression of GFP-Lc3 in a zebrafish caudal fin before, at the time of amputation and 2, 4 and 6 days thereafter (dpa). Left: light microscopy images; right: the corresponding fluorescent images. (b) Quantification of fluorescence intensity for a representative fin ray during regeneration. The plane of amputation is kept fixed, and fluorescence is shown relative to this position. Intensity was plotted for the same fin ray over the regeneration period using ImageJ. (c) Confocal images of a 2dpa GFP-Lc3 blastema. Some GFP-positive foci labelling autophagic elements are interconnected by filamentous structures. The white broken line indicates the amputation plane. (d) Western blots of intact and regenerating tails indicate a strong increase in the amount of complexed Atg5. On average, the amount of Atg5 complexes is roughly 60% higher in 2dpa regenerates than in control tissues, and in regenerating blastemas, we consistently detect a new ~47-kDa complex, besides the more common ~56-kDa one |
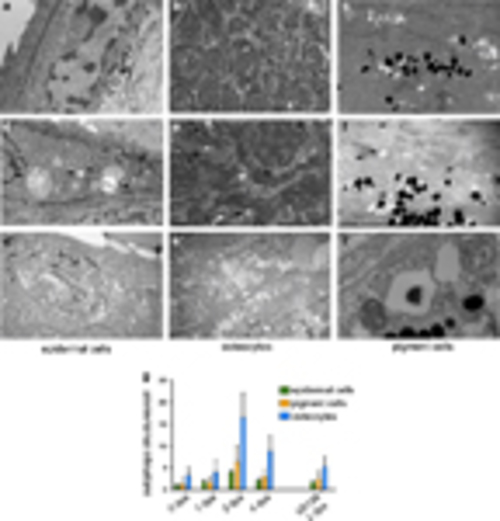
Ultrastructural evidence for an increase in autophagy in the regenerating blastema tissue. Electron microscopy pictures of epidermal cells (a), osteocytes (b) and pigment cells (c) from the tail tip region of control animals show no sign or only low levels of autophagic activity. In the corresponding tissues of the regenerating zone of a 2-dpa fin, elevated numbers of autophagic structures (arrowheads) can be observed (d–f2). (g) The quantification of autophagic vesicles in our EM data set shows a temporary increase in the number of these structures, with the maximum observed at 2dpa and a consequent decrease by 4dpa (n=25 for 0-dpa, 1-dpa and 2-dpa samples, and n=15 for the 4-dpa data set). The difference is highly significant for all three examined cell types (P<0.005). In U0126-treated animals (n=25) at 2dpa, the amount of autophagic structures is significantly lower (P<0.0001) (Student’s t-test, error bars refer to S.E.M.) |

Macroautophagy is required for caudal fin regeneration. (a–c) When Atg5MO was injected into dorsal areas of 2-dpa blastemas, regeneration was severely compromised 1 day after the injection, compared with uninjected ventral fins (black arrowheads indicate site of injection). On panels b2 and b22, additional examples of 3dpa, 1 day post injection regenerates are shown. Statistical analysis (c) was performed for n=9 fins, P<0.001 (indicated by ***), paired t-test. (d) The efficacy of the Atg5MO was tested in western blots. In 1-dpf embryos the intensity of the band demarking the Atg12-Atg5 complex was reduced to less than 20%, indicating a potent inhibition of the Atg5 translation. (e) The effectiveness of the Atg5MO in inhibiting regeneration was significant compared with MilliQ water (MQ) and a standard control vivo MO (vivocntrlMO). (Statistical analysis was performed for n=5 fins from isogenic wild-type tue background fish for each treatment, P<0.001 for each pairwise comparison (indicated by **), unpaired t-test.) (f–h) Regenerating fins were treated with either DMSO (f) or bafilomycin A1 (g), a potent inhibitor of autophagosome-autolysosome fusion. The latter treatment significantly impaired regeneration (h) at 5dpa (n=6 fins, P<0.05, unpaired t-test). (i and j) When the fins of GFP-Lc3 transgenic fish were amputated, treatment with bafilomycin A1 led to a massive accumulation of the reporter in the blastema (i), as compared with DMSO controls (i). Inset in (j) shows the dorsal area of the representative fin at higher magnification. Dotted lines indicate amputation sites. Dpa, days post amputation; hpi, hours post injection; dpi, days post injection. Error bars refer to S.E.M. |
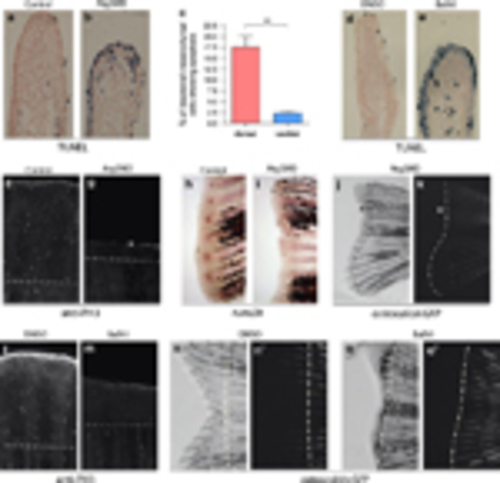
Reduced autophagic activity impairs cell survival, proliferation and differentiation during regeneration. (a–c) When dorsal 2-dpa blastema cells were injected with Atg5MO and fixed at 6hpi, TUNEL staining showed increased cell death in the blastemal mesenchyme of treated fin halves, suggesting that autophagy is required for the survival of dedifferentiating cells. (For the statistical analysis apoptotic and non-apoptotic cells were counted on 62 ventral and 49 dorsal sections, **P<0.01, paired t-test.) (d and e) Chronic treatment with bafilomycin A1 also results in reduced regeneration and increased cell death at 2dpa in the blastemal mesenchyme. (f and g) At 3dpa significant amount of mitotic cells, marked by anti-phospho-histone 3 staining can be detected in a control blastema, whereas the number of proliferating cells is significantly reduced in Atg5MO-injected blastemas. (h and i) Six hours post injection 2-dpa caudal fins were fixed and stained for runx2b expression. Whereas the uninjected ventral half shows runx2b staining in the blastema at the tip of the individual fin rays (h), in injected dorsal blastema no staining could be observed (i), suggesting that the survival of pre-osteoblasts was impaired upon morpholino treatment. (j and k) An amputated adult fish shows no osteocalcin:GFP expression at 6dpa in the Atg5MO-treated dorsal areas. White lines indicate the extent of GFP expression in the bright field (left) and the corresponding fluorescent image (right). The asterisk indicates parts of the blastema tissue that fail to express osteocalcin. (l and m) Chronic treatment with bafilomycin A1 decreases the number of mitotic cells at 3dpa. (n–o2) Long-term impairment of autophagic activity with bafilomycin A1 suppresses (re)differentiation as shown by the osteocalcin:GFP reporter line in 6dpa regenerates. Unlike in controls (n2), in treated fish no new osteocalcin-positive cells could be observed at 6dpa in the fin (o2) (Dashed lines denote the plane of amputation.) |

Inhibition of the Mapk/Erk signalling pathway blocks regeneration and impairs autophagy induction in the blastema. (a and b) Inhibition of Mapk/Erk signalling using U0126 impaired caudal fin regeneration (panels a2 and b2 are magnifications from the central fin areas of the samples on panels a and b, respectively). (c and c2) Inhibition of Ras-MAPK signalling using a transgenic hs:DNRas reporter line also impaired regeneration and blastema formation. (d and e) Regeneration of caudal fin can be inhibited with SU5402, which also results in a decrease in GFP-Lc3 activity. (f–i) mkp3 expression does not depend on autophagic activity. Atg5MO-injected dorsal fin blastemas express mkp3 at levels comparable to that in uninjected ventral fins (f and g). Similarly, mkp3 staining displays a similar extent of labelling in DMSO-treated control (h) and autophagy-defective, bafilomycin A1 (BafA1)-treated backgrounds (i). (j–l) Serum-starved, DMSO-treated GFP-mRFP-LC3 HeLa cells show significant levels of autophagic activity, as denoted by the yellow and red puncta (autophagosomes and autolysosomes, respectively) (j and l). When 10μM or 100μM U0126 was added to the medium, we observed a drop in the autophagic activity (k and l). At concentrations comparable to our treatments, the effect of U0126 was highly significant (l). n=43 cells measured in both control and treated groups, ***P<0.001, unpaired t-test, error bars refer to S.E.M. (m) Schematic diagram showing the proposed interaction between the Fgf-Mapk/Erk signalling axis and autophagy. Injury activates Fgf signalling in the fin, which leads to the phosphorylation of Mapk/Erk. Activated Mapk/Erk regulates the sequestration step of autophagy, an essential step in the degradation of the cytosolic component. The small molecule reagents and the MO used in this study inhibit the process at the indicated steps. The three arrows from ‘ERK’ to ‘Autophagy’ indicate an indirect link between Mapk/Erk signalling and autophagy |