
- Title
-
p53-Mediated Biliary Defects Caused by Knockdown of cirh1a, the Zebrafish Homolog of the Gene Responsible for North American Indian Childhood Cirrhosis
- Authors
- Wilkins, B.J., Lorent, K., Matthews, R.P., and Pack, M.
- Source
- Full text @ PLoS One

Zebrafish cirh1a is expressed in the developing liver and anterior gastrointestinal tract. (A-C) Whole-mount in situ hybridization for cirh1a mRNA, showing widespread expression at 20 hpf (A), followed by expression in the developing liver, gallbladder/pancreas, and anterior intestine at 3 dpf (B-C). (D) Close-up image of panel (C). (E) Immunohistochemistry and fluorescent in situ hybridization in 4 dpf Tg(bglob:EGFP) larvae, showing widespread cirh1a liver expression with focal expression in GFP-positive biliary cells (arrowheads). (F) Quantitation of cirh1a expression in GFP-positive biliary cells in 3 dpf and 4 dpf Tg(bglob:EGFP) larvae. EXPRESSION / LABELING:
|

Liver histology and ultrastructure in Cirhin-deficient larvae. (A-F) Liver histology of wild-type (A-C) and Cirhin-deficient (D-F) larvae is indistinguishable, although liver size and yolk consumption are decreased in Cirhin-deficient larvae as a result of mild developmental delay (D-E). Insets in B-C, E-F are high-magnification views of associated panel. (G-L) Transmission electron microscopy of wild-type (G-I) and Cirhin-deficient (J-L) larvae. Compared to wild-type, Cirhin-deficient hepatocytes have increased rough endoplasmic reticulum (J, red asterisk) and occasional cytoplasmic lamellations consistent with bile (K-L, black arrowheads). Biliary cells are outlined by red dashed lines and appear normal (H,K). PHENOTYPE:
|
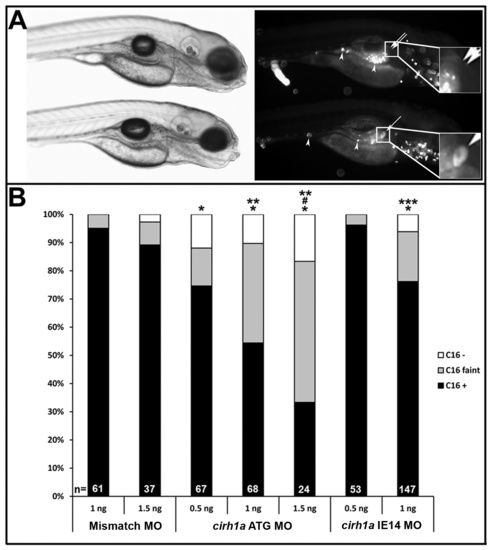
Cirhin-deficient larvae have dose-dependent defects in hepatobiliary function. (A) Brightfield (left) and fluorescent (right) images of two cirh1a IE14 MO-injected 5 dpf larvae, 2 hours following their ingestion of BODIPY-FL C16 and fluorescent microspheres. Lower larva shows fluorescent lipid accumulation in gallbladder (single arrow and lower inset) indicating normal biliary function, while the other larva has defective biliary function and non-visible gallbladder (double arrow and upper inset), despite normal swallowing of substrate in both fish (fluorescent microspheres in gut, arrowheads). (B) Quantitation of gallbladder fluorescence in control and Cirhin-deficient larvae that had been injected with either the translation-blocking (ATG) or splice-blocking (IE14) MO. *, p<0.05 vs Mismatch MO 1 ng; #, p<0.05 vs Mismatch MO 1.5 ng; **, p<0.05 vs cirh1a ATG MO 0.5 ng; ***, p<0.05 vs cirh1a IE14 MO 0.5 ng. PHENOTYPE:
|

Cirhin-deficient larvae have defects in biliary and canalicular morphology. (A-C) Confocal projections of 5 dpf livers immunostained with antibodies against canalicular marker MDR (red) and biliary epitope 2F11 (green). Livers from fish with normal BODIPY-FL C16 processing (A) show elongated canaliculi intersecting with normally arborized biliary networks. In contrast, fish with reduced fluorescent lipid processing (B and C) show truncated, rounded canalicular profiles and more sparse biliary networks. Insets show high-magnification view of one or few cells to highlight canalicular morphology. (D) Semiquantitative scoring of canalicular morphology, with 1+=0-25% elongated, 2+=26-50% elongated, 3+=51-75% elongated, and 4+=76-100% elongated. *, p<0.05 vs Mismatch MO 1 ng. |

Activation of p53 pathway in Cirhin-deficient larvae. (A) RT-PCR with primers directed at cirh1a exons 13-15, demonstrating altered mRNA splicing following injection of IE14 MO (arrowhead). (B) Schematic of cirh1a alternative splicing due to IE14 MO, with alternate inclusion of intron 14 creating an in-frame stop codon. (C-E) Quantitative RT-PCR for tp53 (C) and p53 targets p21 (D) and mdm2 (E), expressed as fold increase over control mismatch MO-injected larvae. *, p<0.05 vs Mismatch MO 1 ng. EXPRESSION / LABELING:
|
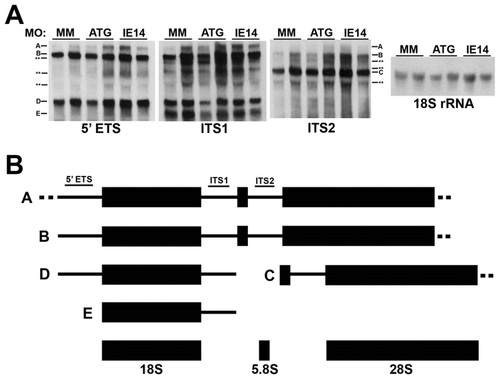
Normal ribosomal RNA processing in Cirhin-deficient larvae. (A) Northern blots demonstrating equivalent levels of pre-rRNA species in duplicate samples of mismatch MO-injected and cirh1a MO-injected embryos. Dashes and letters correspond to presumed pre-rRNA species identified by probes 5′ETS, ITS1, and ITS2, while asterisks indicate unknown pre-rRNA species (schematized in panel B). The far right panel shows the results of blotting with an 18S rRNA probe, demonstrating total RNA loading. Mean 45S/18S rRNA ratios were not statistically different between treatment groups (p>0.05). (B) Schematic depicting presumed pathway of zebrafish ribosomal RNA processing; individual RNA species not drawn to scale (adapted from [32]). PHENOTYPE:
|
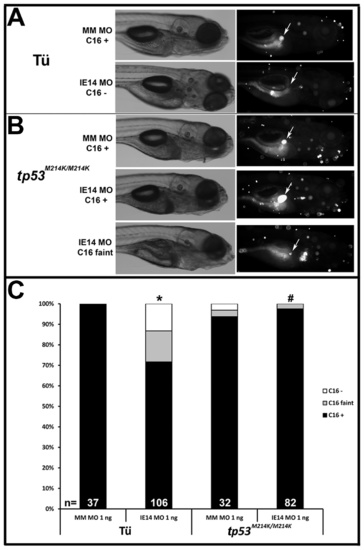
Biliary defects in Cirhin-deficient larvae are abrogated by tp53 mutation. (A) Brightfield (left column) and fluorescent (right column) images of representative 5 dpf wild-type Cirhin-deficient larvae (BODIPY-FL C16 assay). Arrows indicate position of gallbladder. (B) Brightfield (left column) and fluorescent (right column) images of representative 5 dpf tp53-mutant Cirhin-deficient larvae (BODIPY-FL C16 assay). Arrows indicate position of gallbladder. (C) Quantitation of gallbladder fluorescence in Cirhin-deficient larvae. *, p<0.05 vs Tu mismatch MO-injected 1 ng; #, p<0.05 vs Tu cirh1a IE14 MO-injected 1 ng. PHENOTYPE:
|

Normal liver size in Cirhin-deficient larvae by Tg(lfabp:dsRed) expression. Merged brightfield and fluorescent microscopic images of live Tg(lfabp:dsRed) larvae at 3 dpf (A, C) and 5 dpf (B, D) injected with control morpholino (A, B) or cirh1a ATG-MO (C, D). Similar results were seen with cirh1a IE14 MO-injected embryos and larvae (data not shown). PHENOTYPE:
|