
- Title
-
MicroRNA-146 function in the innate immune transcriptome response of zebrafish embryos to Salmonella typhimurium infection
- Authors
- Ordas, A., Kanwal, Z., Lindenberg, V., Rougeot, J., Mink, M., Spaink, H.P., and Meijer, A.H.
- Source
- Full text @ BMC Genomics
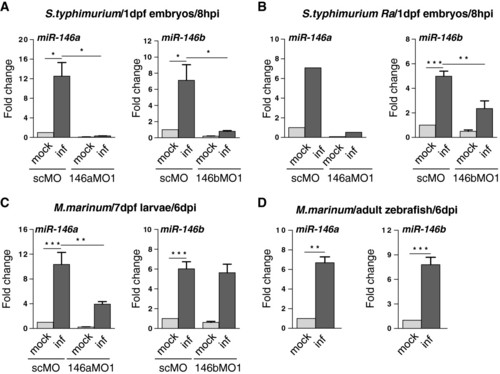
Expression of miR-146a and miR-146b is enhanced upon bacterial infections. (A) MiR-146a/b induction in zebrafish embryos by S. typhimurium. Embryos were injected with S. typhimurium SL1027 (inf) or PBS (mock) at 28 hpf and expression of miR-146a/b was analyzed at 8 hpi. The specificity of miRNA inductions was analyzed with morpholinos (MO) targeting miR-146a (146aMO1) or miR-146b (146bMO1). As a control a standard control morpholino (scMO) was injected. Data are the mean ± SEM of samples from two independent experiments. (B) MiR-146a/b induction by the attenuated S. typhimurium LPS mutant (Ra) strain SF1592. Experimental conditions were the same as for infection with wild type S. typhimurium (miR-146a: single experiment, miR-146b: mean ± SEM of three replicates). (C) MiR-146a/b induction in zebrafish larvae with M. marinum infection. Embryos were treated with miR-146a/b-targeting or control morpholinos as above, injected with M. marinum Mma20 (inf) or PBS (mock) at 28 hpf, and expression of miR-146a/b was analyzed in larvae at 6 dpi. Data are the mean ± SEM of samples from two independent experiments. (D) MiR-146a/b induction in M. marinum-infected zebrafish adults. Adult zebrafish were injected intraperitoneally with M. marinum Mma20 or mock-injected with PBS and RNA was collected at 6 dpi[35]. Data are the mean ± SEM of three fish per condition. Expression levels in all experiments were determined by TaqMan qPCR and relative expression levels are shown with the mock control set at 1. Asterisks indicate significant differences (*, P < 0.05; **, P <0.01; ***, P <0.001) tested by one-way ANOVA analysis with Tukey’s method as post-hoc test (A-C) or by an unpaired t-test (D). |

The Traf6-MyD88 pathway is involved in up-regulation of miR-146a and miR-146b expression levels upon infection. (A) Traf6-dependent miR-146a/b induction. Embryos were injected with traf6 morpholino (MO) or a mismatch morpholino (MM) as a control. Embryos were infected at 28 hpf with S. typhimurium (inf) or mock-injected with PBS and samples were collected at 8 hpi. (B) MyD88-dependent miR-146a/b induction. Mutant (myd88-/-) and wild type siblings (myd88+/+) were infected with S. typhimurium at 28 hpf followed by sample collection at 8 hpi. Expression levels in both experiments were determined by TaqMan qPCR and relative expression levels are shown with the mock control set at 1. Data are the mean ± SEM of three replicate sample sets. Asterisks indicate significant differences (*, P < 0.05; **, P <0.01) tested by one-way ANOVA analysis with Tukey’s method as post-hoc test. EXPRESSION / LABELING:
|

Knockdown of miR-146a and miR-146b does not affect leukocyte development. Embryos were injected at the 1-cell stage with morpholinos targeting miR-146a (146aMO1 and 146aMO2) or miR-146b (146bMO1 and 146bMO2) or were injected with standard control morpholino (scMO). (A, B) Confirmation of morpholino knockdown. Embryos were injected with the indicated morpholinos and RNA was collected at 2 dpf. Knockdown of miR-146a (A) and miR-146b (B) was confirmed by TaqMan qPCR. This analysis also demonstrated the specificity of morpholinos 146aMO1, 146aMO2, and 146bMO2 for their respectively target miRNAs, whereas 146bMO1 could not discriminate between the a and b forms of miR-146. 146bMO2 positively affected miR-146a expression besides blocking miR-146b expression and caused developmental aberrations (J, K). (C) Quantification of L-plastin-positive leukocytes at 2 dpf. Embryos were injected with the control morpholino (scMO) or with a combination of 146aMO1 and 146bMO1 (146a/bMOs). L-plastin-labelled cells were counted manually on the left side of each embryo and the numbers present in the head, on the yolk sac, and in the tail were accumulated (n e 26 embryos per group). (D) Quantification of Mpx-positive neutrophils at 2dpf. Embryos were injected with the indicated morpholinos. Neutrophils stained for Mpx activity were counted manually as described for L-plastin immunostaining (n e 13 embryos per group). (E) Quantification of L-plastin-positive leukocytes at 26, 28, 30 and 32 hpf. Embryos were injected with the indicated morpholinos and L-plastin-labelled cells were counted as described above (n e 16 embryos per time point). (F-K) Example fluorescence images of the data shown in (E). The pattern of L-plastin-positive immune cells was comparable between embryos (32 hpf) injected with scMO (F), 146aMO1 (G), 146aMO2 (H), and 146bMO1 (I). 146bMO2 gave non-specific phenotypes and the number of immune cells was more variable dependent upon the severity of the phenotype (J, K). |
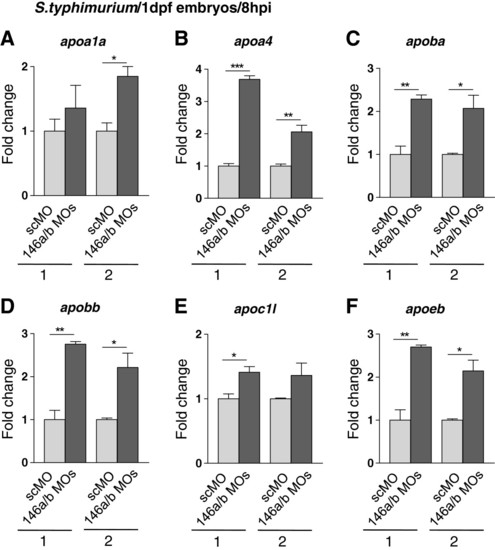
Increased infection-induction of apolipoprotein gene expression under conditions of combined miR-146a and miR-146b knockdown. (A-F) Embryos were injected with control morpholino (scMO) or with a combination of 146aMO1 and 146bMO1 (146a/bMOs) and infected with S. typhimurium as described in Figure 5. Gene expression levels of six apolipoprotein genes, apoa1a (A), apoa4 (B), apoba (C), apobb (D), apoc1l (E), and apoeb (F), were analyzed by qPCR in two replicate infection experiments (1 and 2) and relative expression levels are shown with the lowest expression level set at 1. Data are the mean ± SEM of triplicate qPCR measurements. Asterisks indicate significant differences (*, P < 0.05; **, P <0.01) determined by an un-paired t-test. |