
- Title
-
A BMP regulatory network controls ectodermal cell fate decisions at the neural plate border
- Authors
- Reichert, S., Randall, R.A., and Hill C.S.
- Source
- Full text @ Development
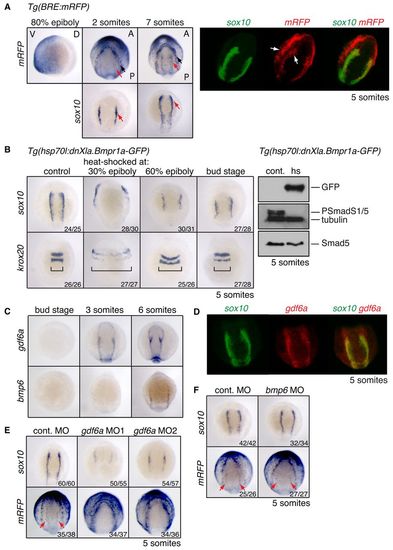
Distinct domains of BMP activity exist at the NPB. (A) (Left) In situ hybridisation (ISH) for mRFP and sox10 in Tg(BRE:mRFP) zebrafish embryos. The 80% epiboly image is a lateral view, ventral to the left. Somitogenesis stages are shown in dorsal anterior view. Black arrow, outer domain of BMP activity; red arrow, inner NC domain. (Right) Double-fluorescent in situ hybridisation (DFISH) using probes against mRFP (Fast Blue, red) and sox10 (fluorescein-TSA, green). Arrows indicate the two distinct domains of BMP activity. Dorsal view, with anterior top right. (B) (Left) sox10 and krox20 ISH on Tg(hsp70l:dnXla.Bmpr1a-GFP) embryos heat shocked at the indicated stages. Brackets indicate the width of the neural ectoderm marked by krox20. (Right) Western blots of 5-somite stage Tg(hsp70l:dnXla.Bmpr1a-GFP) embryos heat shocked (hs) at bud stage, using the antibodies indicated. The control (cont.) corresponds to sibling embryos that were not heat shocked. (C) ISH for gdf6a and bmp6 at the stages indicated. (D) DFISH for sox10 and gdf6a. Dorsal view, with anterior to top. (E,F) Wild-type or Tg(BRE:mRFP) embryos were injected with 10 ng control MO or MOs against gdf6a (E) or bmp6 (F) and stained for sox10 or mRFP. Red arrows indicate the inner domain of BMP signalling as visualised by mRFP. The number of embryos with the observed phenotype among total embryos examined for a representative experiment is given bottom right. V, ventral; D, dorsal; A, anterior; P, posterior. EXPRESSION / LABELING:
|
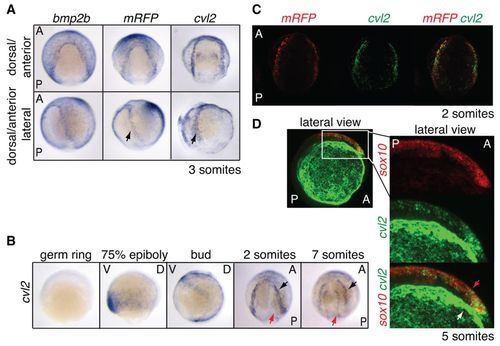
cvl2 expression colocalises with domains of active BMP signalling and is required for NC induction. (A) ISH for bmp2b, mRFP and cvl2 in dorsal anterior view (top) and the same embryos turned 45° to the left (bottom). Arrows mark the sharp expression domain of mRFP and cvl2 at the NPB. (B) Timecourse of cvl2 expression. Germ ring to bud stage shown in lateral view, dorsal to the right. Somite stages are shown in dorsal anterior view, anterior to top. Arrows indicate the two domains of cvl2 expression. (C) DFISH reveals colocalisation of mRFP (red) and cvl2 (green) mRNA at the NPB. Dorsal anterior view. (D) DFISH for sox10 (red) and cvl2 (green). Lateral view with anterior to the right. Strong green staining reveals the outer domain of cvl2 expression (white arrow). Weaker green staining is visible in the NC (sox10; red arrow). EXPRESSION / LABELING:
|
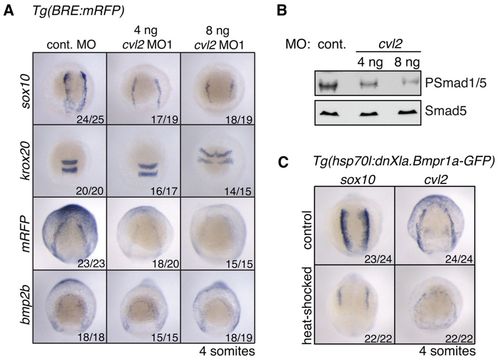
cvl2 is required for NC induction. (A) ISH on Tg(BRE:mRFP) embryos injected with 8 ng control MO or either 4 ng or 8 ng of cvl2 MO1. Dorsal anterior views, with anterior to the top. Embryos were fixed at the 4-somite stage. (B) Western blot analysis showing dose-dependent reduction of PSmad1/5 levels in the cvl2 morphants at 80% epiboly. (C) ISH on Tg(hsp70l:dnXla.Bmpr1a-GFP) embryos heat shocked at bud stage using probes directed against sox10 and cvl2. EXPRESSION / LABELING:
|

dlx3b/4b are required for NC induction and formation of the NC BMP signalling domain. (A) sox10 and cvl2 ISH on wild-type embryos (left set of panels) and sox10 and mRFP ISH on Tg(BRE:mRFP) embryos (right set of panels). Embryos were injected with 14 ng control MO or 7 ng each of MOs against dlx3b and dlx4b. Arrows indicate the inner expression domain of cvl2 and mRFP. (B) Analysis of expression domains at the NPB in dlx3b/4b morphants as compared with control MO-injected embryos using DFISH against ncad and cvl2. Arrows indicate the inner cvl2 expression domain. Dorsal anterior view, anterior to top left. (C) ISH on embryos injected with dlx3b/4b or control MOs using probes directed against the PPE markers eya1 and six4.1. Dorsal anterior view, anterior to the top. (D) sox10, mRFP and dlx3b ISH on embryos injected with 4 ng cvl2 MO1 or control MO. Embryos were fixed when they had reached the 5-somite (A-C) or 4-somite (D) stage. EXPRESSION / LABELING:
|

dlx3b induces the expression of bambi-b in the PPE to suppress localised BMP activity and allow tissue specification at the NPB. (A) Temporal expression analysis of bambi-b by ISH (top) and qRT-PCR (bottom). Two orientations (indicated by arrows on the drawings) are shown for the same embryo at each stage (top row in anterior view with anterior to the top). Arrowheads indicate the stripes of bambi-b expression at the NPB. Error bars indicate s.d. of triplicates. (B) HEK293T cells transfected with control plasmid or pCS2+-FLAG-Bambi-b were treated with different concentrations of BMP4 (2, 4, 10 and 20 ng/ml) for 1 hour, or with the BMP receptor inhibitor LDN-193189 for 3 hours. Whole cell extracts were western blotted using the indicated antibodies. PS1/5, PSmad1/5. (C) HEK293T cells were transfected with control plasmid or pCS2+-FLAG-Bambi-b or HA-ALK3. FLAG-Bambi-b was immunoprecipitated from whole cell extract and the immunoprecipitates were western blotted for HA. The inputs are also shown. Actin provided a loading control. (D) (Top) ISH for sox10, cvl2 and mRFP on bambi-b morphants as compared with controls. Embryos were injected with 10 ng bambi-b or control MO and fixed at the 5-somite stage. Dorsal anterior view, anterior to the top. (Bottom) Synthetic mRNA corresponding to native bambi-b was translated in reticulocyte lysate in the presence of 0.2 mM bambi-b MO and [35S]methionine. Translation products were separated by SDS-PAGE and visualised by autoradiography. (E) ISH for sox10 and bambi-b on dlx3b/4b morphants compared with control MO-injected embryos fixed at the 4-somite stage. Views and arrows/arrowheads are as in A. (F) FLAG-Dlx3b expressed in HEK293T cells was assessed for binding to DNA using a bandshift assay. The wild-type probes correspond to the two putative Dlx3b binding sites in the bambi-b gene and the mutant probes contain point mutations in the binding sites. The Dlx3b-DNA complexes are indicated, as are the supershifted complexes that additionally contain the anti-FLAG antibody. ep, epiboly; ss, somitogenesis stage. EXPRESSION / LABELING:
|

A two-step model for zebrafish ectodermal patterning. Step 1 depicts the DV gradient present during gastrulation. High BMP activity is observed ventrally as generated by bmp2b/4/7a ligand expression and reinforced by Cvl2. BMP activity is inhibited dorsally by expression of the diffusible antagonists Chordin and Noggin. Prospective PPE and NC are formed at intermediate levels of BMP signalling. In step 2 the initial gradient has reshaped into distinct BMP activity domains during neurulation. The regulatory network is depicted. Components in black act positively, whereas those in red act negatively. NC, neural crest; PPE, preplacodal ectoderm. EXPRESSION / LABELING:
|

Identification of the BMP/GDF ligands involved in BMP signalling at the NPB. (A) ISH for mRFP on Tg(hsp70l:dnXla.Bmpr1a-GFP) x Tg(BRE:mRFP) embryos, heat-shocked at the indicated stages, demonstrates inhibition of BMP signalling. Black arrows indicate outer domains and red arrows indicate inner domains of BMP activity. (B) ISH for bmp2b and bmp7a on wild-type embryos. Black arrow indicates the position of neural crest at this developmental stage. (C) Temporal expression analysis of bambi-b, and gdf6a using qRT-PCR. The levels were normalised to those of ef1a. Developmental stages are indicated. (D) qRT-PCR indicates that the splice-blocking gdf6a MO1 and MO2 inhibit splicing of gdf6a exon1 to exon2. The levels were normalised to those of ef1a. (E) The bmp6 MO is effective as a translation blocker. The bmp6 MO binding site was cloned upstream and in frame with GFP in pCS2+. The plasmid was transcribed and translated in rabbit reticulocyte lysate in the presence of increasing amounts of bmp6 MO, the concentrations of which corresponded to in vivo doses of between 5 and 15 ng per embryo. GFP production was assayed by Western blot and tubulin acts as a loading control. In A the numbers indicate embryos with the observed phenotype for a representative experiment. |

Cvl2 is required for neural crest specification. (A) ISH analysis of embryos injected with 4 ng control MO or cvl2 MO1 using probes against the neural crest marker snai1b. Embryos were fixed at the five-somite stage Dorsal anterior view, anterior to the top. (B) ISH on Tg(BRE:mRFP) embryos injected with 4 ng control MO or 4 ng cvl2 MO2 or MO3. Dorsal anterior views, with anterior to the top. Embryos were fixed at the three-somite stage. (C and D) Alcian blue cartilage staining of 5-day old zebrafish larvae, injected with 2 ng p53 morpholino (Robu et al., 2007) and either 4 ng control or 4 ng cvl2 MO1 (C) or 4 ng control MO or cvl2 MO2 or MO3 (D). Note that the phenotype of the cvl2 MO1 morphants may be compounded by some additional deleterious effects that manifest themselves at this late stage. The numbers indicate embryos with the observed phenotype for a representative experiment. |

Formation of domains of mRFP, dlx3b and cvl2 expression at the NPB. (A) DFISH for dlx3b/mRFP at different developmental stages. Dorsal anterior view, with anterior to the top. Developmental stages are indicated at the top. (B) dlx3b/ mRFP and cvl2/mRFP DFISH at the one-somite stage. White brackets indicate width of the respective mRNA expression domains. Dorsal view; anterior to the top. |