
- Title
-
Spinal Deformity in Aged Zebrafish Is Accompanied by Degenerative Changes to Their Vertebrae that Resemble Osteoarthritis
- Authors
- Hayes, A.J., Reynolds, S., Nowell, M.A., Meakin, L.B., Habicher, J., Ledin, J., Bashford, A., Caterson, B., and Hammond, C.L.
- Source
- Full text @ PLoS One
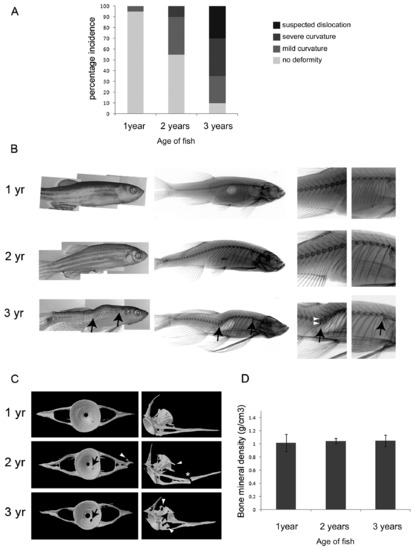
Aging zebrafish show gross morphological changes to the vertebral column. A. Graph showing incidence (%) of deformities by age. n=20 for each age group. B. Gross morphological appearance (left panel) and corresponding radiology (middle and left panels; left panels show detail of trunk and tail vertebrae) of zebrafish at 1, 2 and 3-years. Black arrows (in bottom panel) denote suspected dislocations of the spine. White arrowheads point to regions of increased bone density in vertebrae surrounding the dislocation. C. MicroCT images showing a representative single reconstructed vertebra (C5) from each age group, black arrows point to regions of bone erosion, white arrowheads point to bony outgrowths; asterisk denotes fracture. D. Graph of average bone mineral density shows no difference to bone density at the different ages, tested by One-way ANOVA; 1 vs 2 year P=0.80, 1 vs 3 year P=0.92, 2 vs 3 year P=0.79. n=3 for each age. |
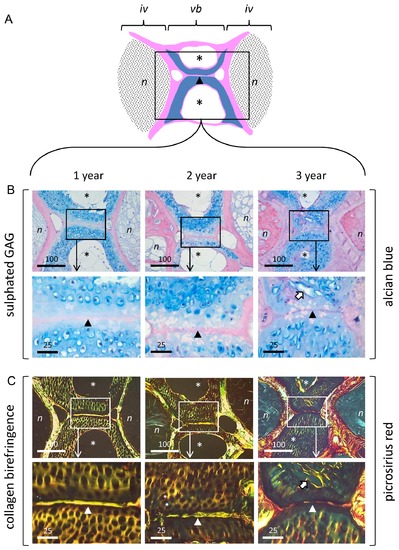
Aging zebrafish show changes in matrix organisation visible at the light microscopic level. A. Schematic showing anatomical organisation of trunk vertebrae/intervertebral disc (mid-sagittal section plane). Vertebral bone depicted in pink; vertebral cartilage in blue; intervertebral discs shaded in black. B. Alcian blue staining of sulfated GAG in 1, 2, and 3 year spines. Upper panel: low power showing discs and interjacent vertebral body. Boxed areas denote regions examined at high power in underlying panel. Lower panel: Detail of Alcian blue staining within vertebral cartilage. Note prominent pericellular localisation of GAG and change in chondron morphology with age. C. Collagen birefringence (Picrosirius red staining under polarising optics) in 1, 2 and 3 year spines. Upper panel: low power showing discs and interjacent vertebral body. Boxed areas denote regions examined at high power in underlying panel. Lower panel: detail of collagen birefringence within vertebral cartilage. N.B. collagen birefringence occurs throughout the ECM at 1 and 2-years, but becomes increasingly organised within the pericellular matrix by 3-years. iv, intervertebral disc; vb, vertebral body; n, notochord-derived tissue; asterisks, cavities within cortical bone of vertebrae; arrow-head, notochordal tract running through cartilaginous inner facet of vertebral bodies; block arrow denotes coalescence of adjacent chondrons in 3 year samples. Scalebar in microns. |

The vertebral cartilage of aged fish display changes in matrix ultrastructure and cell morphology. A. Representative images showing the ultrastructure of vertebral cartilage, chondrocytes and pericellular matrix (top panel, middle panel and bottom panel, respectively) at 1, 2 and 3-years (left, middle and right panels, respectively). Chondrocytes display morphologies suggestive of programmed cell death at all stages. Note prominent lacunae in 2 and 3 year samples and increase in electron density of surrounding ECM. B. Graph showing mean lacunal area at each age. Note significant increase in 2 and 3-year samples, relative to 1 year samples tested by One-way ANOVA; 1 vs 2 year P=3.26E-07, 1 vs 3 year P=0.00945, 2 vs 3 year P=0.0512. C. Graph showing percentage area occupied by cell at each age. Note significant decrease in 2 and 3 year samples, relative to 1 year samples tested by One-way ANOVA; 1 vs 2 year P=1.13E-15, 1 vs 3 year P=1.61E-10, 2 vs 3 year P=0.357. l, lacunae; v.; intracellular vacuoles; black asterisks, vesicular debris; black arrows denote myelin figures; white arrows show condensed nuclear material; black arrowhead shows discontinuity of cell membrane. Scalebar in microns. |
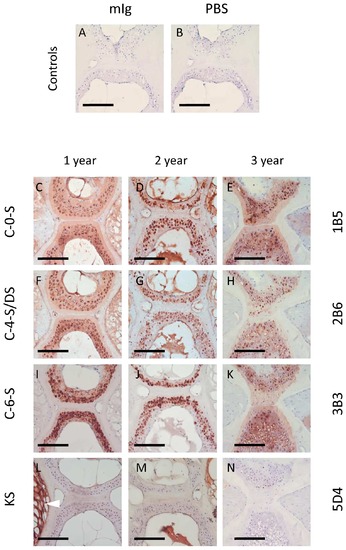
The vertebral cartilage of aging fish is rich in chondroitin, but not keratan, sulfate. A-B. Immunohistochemical labelling controls showing no non-specific binding of primary (mIg, ‘naive’ mouse immunoglobulin) or secondary antibody (PBS, phosphate buffered saline). C-N. Immunohistochemical labelling patterns of chondroitin/dermatan (C-0-S, C-4-S/DS, C-6-S) and keratan sulfate (KS) at 1, 2 and 3 years (left, middle and right panels, respectively). Note prominent pericellular labelling of CS/DS epitopes, particularly in 2 and 3 year samples. Unlike CS, KS occurs only within the notochordal tissue of the intervertebral disc (bottom left; arrowhead) and appears to diminish during aging. Scalebar represents 100 microns. |