
- Title
-
Notch receptor expression in neurogenic regions of the adult zebrafish brain
- Authors
- de Oliveira-Carlos, V., Ganz, J., Hans, S., Kaslin, J., and Brand, M.
- Source
- Full text @ PLoS One
Notch receptor expression in the adult zebrafish telencephalon. EXPRESSION / LABELING:
|

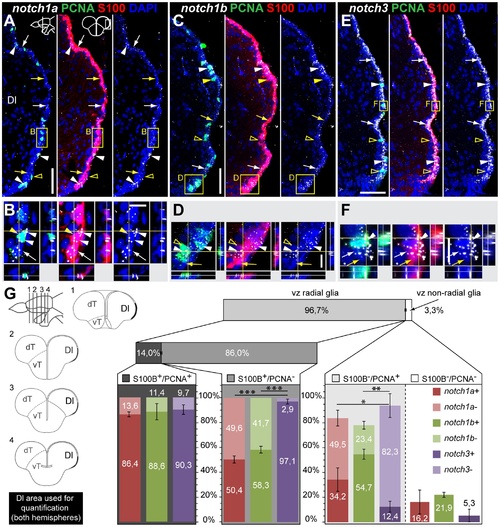
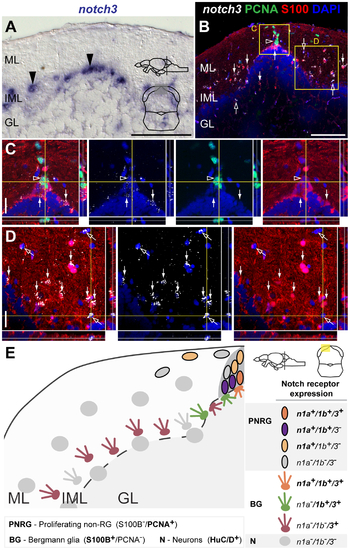
notch1a, notch1b and notch3 expression in radial glia and proliferating cells of the dorso-medial ventricular zone of the telencephalon. Confocal images showing localization of Notch receptors by FISH (white), radial glia labelled with S100β (red), and PCNA + proliferating cells (green); DAPI (blue) is used as nuclear counterstaining. Schematics in A indicate the cross-section levels through the telencephalon and the dorsal telencephalic area represented in the micrographs. A-C, notch1a and D-E, notch1b expressing cells are scattered throughout the dorso-medial ventricular zone of the dT and co-localize with both PCNA +/S100β + cells (filled arrowheads) and a subpopulation of PCNA -/S100β+ cells (white arrows); yellow arrows indicate Notch receptor -/PCNA -/S100β + cells; unfilled yellow arrowheads indicate notch1b - /PCNA + cells. F-H, notch3 expressing cells localize to a great extent with the S100β marker, including both PCNA (white arrows) and PCNA (white arrowheads) cells; unfilled yellow arrowheads indicate notch3 - /PCNA + cells. I, Schematics indicating the cross-sections levels through the telencephalon, along the rostro-caudal axis, and examples of Dm areas used for marker co-localization analysis in J. J, Quantification on the co-localization of Notch receptor by FISH with PCNA and S100β, for the Dm region; all ventricularly located cells of the indicated area were counted; cells were distinguished based on their glia character (S100β+ ), Notch receptor expression and proliferative status (PCNA +). n = 9 (fish), 4-6 tissue sections per fish, at the rostro-caudal levels indicated in I; total number of cells counted = 7245. Values represented as mean percentage SEM. Significance levels: p<0.00(***),p<0.05(*) . Abbreviations: Dm, dorso-medial telencephalic area; dT, dorsal telencephalic area; vT, ventral telencephalic area; Scale bars = 50 μmin A, in D and in F; 10 μm in C (applies to B), in E and in H (applies to G). EXPRESSION / LABELING:
|
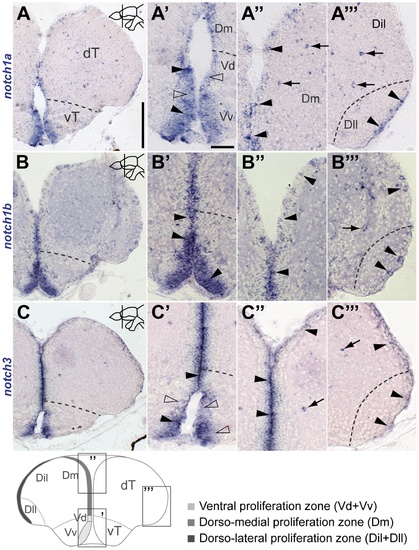
notch1a, notch1b and notch3 expression in radial glia and proliferating cells of the dorso-lateral telencephalic ventricular zone. EXPRESSION / LABELING:
|

Overlapping and complementary Notch receptor expression in the dorsal telencephalon. EXPRESSION / LABELING:
|
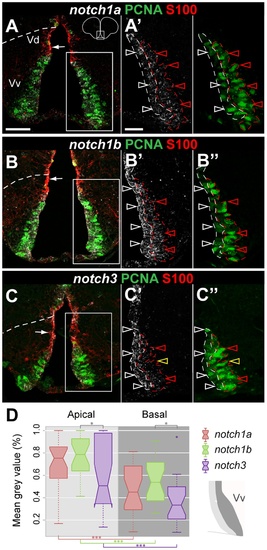
Notch receptor expression in the ventral telencephalic proliferation zone. EXPRESSION / LABELING:
|
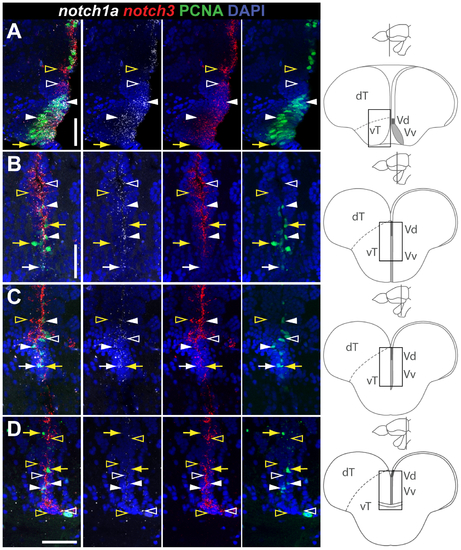
Overlapping and complementary notch1a/3 expression in the ventral telencephalic proliferation zone, along the rostro-caudal axis. EXPRESSION / LABELING:
|

Notch receptor expression in the adult zebrafish hypothalamus. EXPRESSION / LABELING:
|
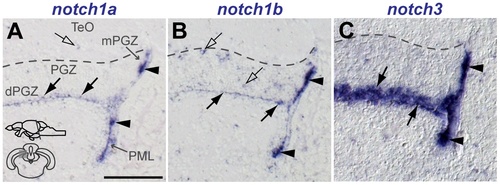
Notch receptor expression in the adult zebrafish optic tectum. EXPRESSION / LABELING:
|
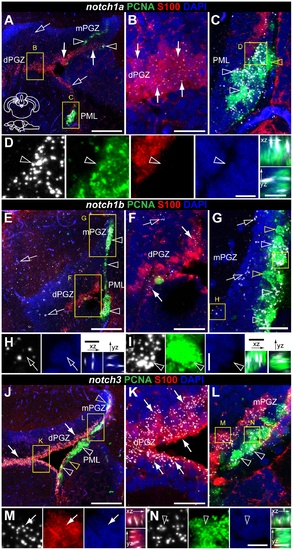
Notch receptor expression in radial glia and proliferating cells of the adult zebrafish optic tectum. EXPRESSION / LABELING:
|
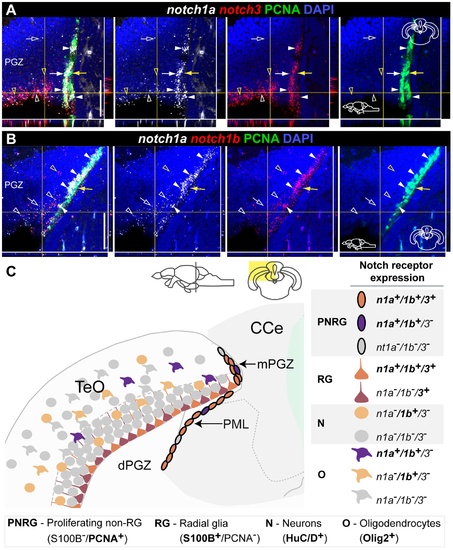
Overlapping and complementary notch1a/3 expression in the adult zebrafish optic tectum. EXPRESSION / LABELING:
|
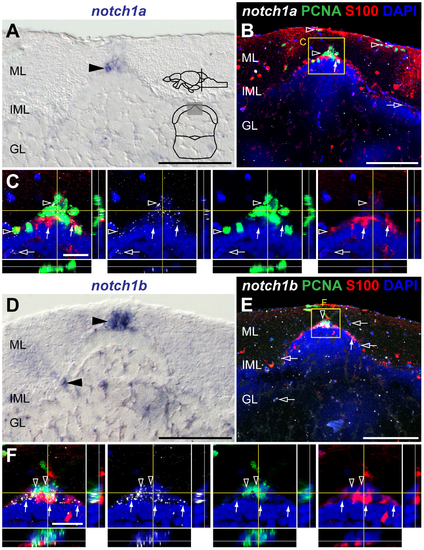
notch1a and notch1b expression in the adult cerebellar niche. EXPRESSION / LABELING:
|
notch3 expression in the adult cerebellar niche. EXPRESSION / LABELING:
|

Notch receptor expression in telencephalic oligodendrocytes. Confocal images of double FISH showing the localization of Notch receptor (white) and olig2 (green) in the dorsal telencephalon parenchyme. A-C, notch1a, notch1b and notch3 are expressed in a subpopulation of parenchymal olig2 cells (white arrows). Yellow arrows indicate Notch receptor - /olig2 + cells; unfilled white arrows in B indicate notch1b + /olig2 - cells. Scale bar = 50 μ in A (applies to all). |

Notch receptor expression in fli1:gfp endothelial cells in the telencephalic parenchyme. Confocal images showing localization of notch1a and notch3 and gfp + endothelial cells in the dorsal telencephalon parenchyme. A–B notch1a and notch3 expression in a few endothelial cells (white arrows); unfilled arrow in B indicates a notch3 + /gfp - cell adjacent to the blood vessel. Scale bar = 20 in A (applies to B). |
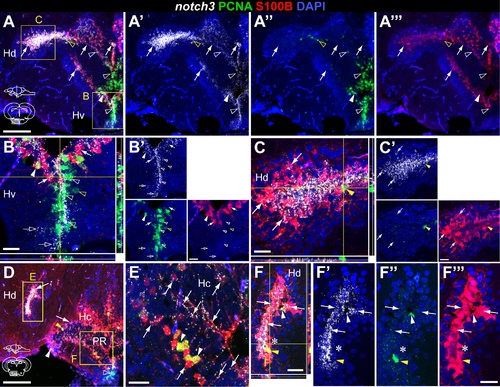
notch3 expression in glia and proliferating cells of the adult zebrafish hypothalamus. Confocal images showing localization of notch3 mRNA by FISH (white), radial glia labelled with S100β (red), and PCNA + proliferating cells (green). Cross-sections at the indicated levels through the diencephalon; hypothalamic area shown in the micrographs is indicated in the cross-section schematics. A, B, notch3 is expressed in most PCNA+ /100β- cells (filled white arrowheads) and in PCNA +/S100β - cells (unfilled white arrowheads) of the Hv; unfilled yellow arrowheads indicate notch3 - /PCNA +/S100β cells. A–F, notch3 localizes with most S100β cells of Hd and Hc, PCNA + (filled white arrowheads) or PCNA (filled white arrows); filled yellow arrowhead indicates a notch3 -/PCNA +/S100β + cell. Notice the notch3 expression in the S100β + cellular processes in Hc (in E). Asterisk indicates a S100β group of cells in Hd that is negative for notch3. Abbreviations: Hc, caudal zone of the periventricular hypothalamus; Hd, dorsal zone of the periventricular hypothalamus; Hv, ventral zone of the periventricular hypothalamus: PR, posterior recess of the diencephalic ventricle. Scale bar = 100 μm in A and D, 20 μm in B, B , C, C , E, F, F . |
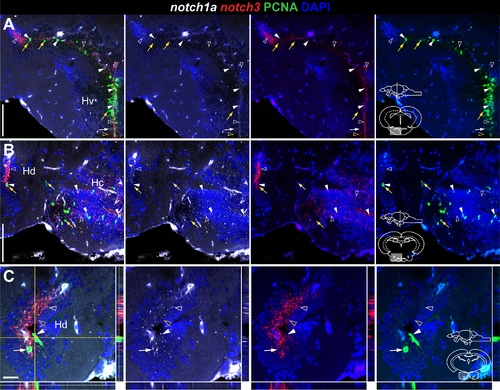
Overlapping and complementary notch1a/3 expression in the adult zebrafish hypothalamus. Confocal images of double FISH showing the localization of notch1a (white), notch3 (red), and PCNA (green). Cross-sections at the indicated level through the diencephalon; hypothalamic area shown in the micrographs is indicated in the cross-section schematics. A–C, notch1a is expressed in a subpopulation of notch3 + /PCNA + cells in Hv, Hd and Hc (filled white arrowheads); yellow arrows indicate Notch receptor - /PCNA + cells; unfilled yellow arrowheads indicate cells expressing notch3 alone. notch1a expression partially overlaps with the notch3 + /PCNA - population (unfilled white arrowheads); there are a few notch1a + /notch3 - /PCNA cells in Hv and Hd (filled white arrows). Abbreviations: Hc, caudal zone of the periventricular hypothalamus; Hd, dorsal zone of the periventricular hypothalamus; Hv, ventral zone of the periventricular hypothalamus. Scale bar = 100 μ in A (applies to B). |
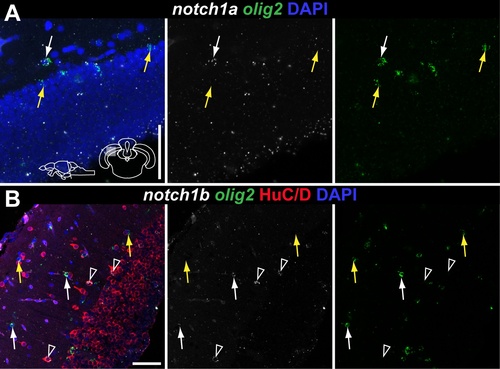
notch1a and notch1b expression in olig2+ and HuC/D + cells of the optic tectum. Confocal images of double FISH showing the localization of notch1a/1b (white), olig2 (green) and HuC/D (red) in the superficial layer of the optic tectum. Cross-sections at the indicated level through the mesencephalon; tectal area shown in the micrographs is indicated in the cross section schematic in A. A–B, notch1a and notch1b are expressed in a subpopulation of olig2 cells (white arrows); yellow arrows indicate Notch receptor - /olig2 + cells. B, notch1b is also expressed in olig2 - /Hu + cells (unfilled white arrowheads). Scale bars = 50 μm. |

Unillustrated author statements EXPRESSION / LABELING:
|