
- Title
-
Eph/Ephrin signalling maintains eye field segregation from adjacent neural plate territories during forebrain morphogenesis
- Authors
- Cavodeassi, F., Ivanovitch, K., and Wilson, S.W.
- Source
- Full text @ Development
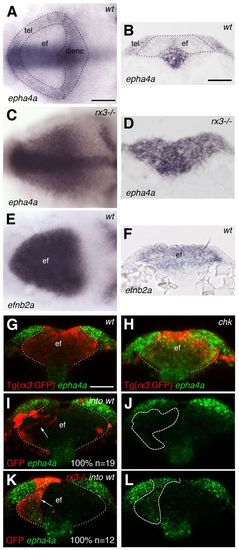
Complementary expression of Ephrins and Ephs in the anterior neural plate (ANP) is lost in zebrafish rx3-/- mutants. (A-F) Whole-mount in situ hybridisations showing the expression in the ANP of epha4a in wild-type (A,B) and rx3-/- (C,D) embryos and of efnb2a in wild-type embryos (E,F). (G,H) Whole-mount in situ hybridisation to detect epha4a expression in the ANP (green) of Tg{rx3:GFP} (G) and Tg{rx3:GFP}; rx3-/- (chk) (H) embryos counterstained for GFP to highlight the eye field (red). (I-L) Transplants of wild-type (I,J) or rx3-/- (K,L) cells (labelled by GFP, red) into wild-type hosts. rx3-/- cells show autonomous activation of epha4a in the eye field (K,L). Arrows (I,K) point to transplanted cells. Dashed/dotted lines outline ANP domains (A), outline the eye field (B,G-I,K) or outline the transplants (J,L). All panels show frontal views with dorsal to the top of 1- to 3-somite stage (ss) embryos, except (A,C,E) which show dorsal views with anterior to the left. ef, eye field; tel, telencephalon; dienc, diencephalon. Scale bars: 50 μm. EXPRESSION / LABELING:
PHENOTYPE:
|
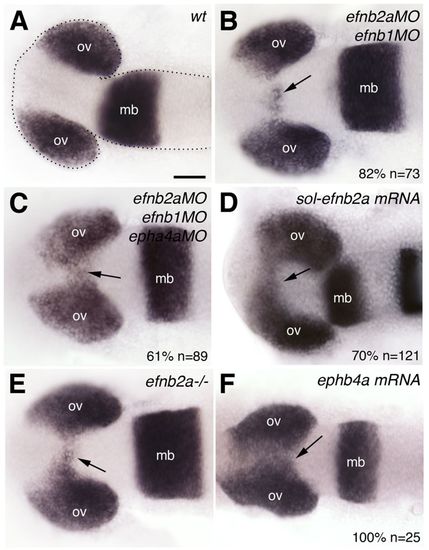
Partial abrogation of Eph/Ephrin activity interferes with optic vesicle evagination. Whole-mount in situ hybridisation in 10-12 ss wild-type zebrafish embryo (A), embryos injected with Eph/Ephrin morpholinos (B,C) or mRNA (D,F), and efnb2a mutant (E). The optic vesicles are labelled by expression of mab21/2. Arrows (B-F) indicate the presence of eye fated cells (labelled by mab21/2) embedded within the forebrain. All panels show dorsal views with anterior to the left. The phenotype shown in C is representative of 61% of the embryos analysed; the remaining 39% are not wild type but show a milder phenotype than that illustrated. The phenotype shown in F is representative for EphA4a and EphB4a misexpressions (epha4a: 70%, n=56; ephb4a: 100%, n=25). mb, midbrain; ov, optic vesicle. Scale bars: 50 μm. EXPRESSION / LABELING:
PHENOTYPE:
|
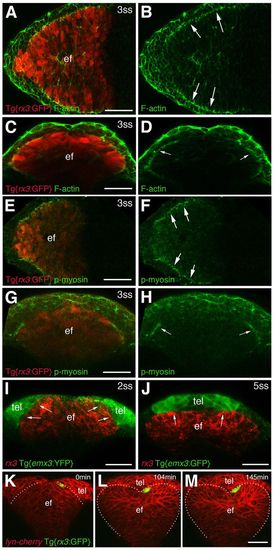
A region of actomyosin activation at the eye field/telencephalic border. (A-H) Whole-mount immunostainings for F-actin and phosphorylated light chain myosin II. Arrows (B,D,F,H) highlight the edge of the eye field. (I,J) Combined in situ hybridisation/immunostaining to detect expression of emx3 (emx3:YFP transgene, green) and rx3 (red). Arrows point at the interface between rx3 and emx3 expression. (K-M) Snapshots taken from supplementary material Movie 1, in which a Tg{rx3:GFP} cell (green) has been transplanted at the edge of the eye field, and its position relative to the boundary then followed over time. The green cell abuts and closely respects the boundary as morphogenesis progresses. The embryo has been counterlabelled with a membrane-tagged form of cherry (Lyn-cherry). All panels show frontal views, except (A,B,E,F) which show dorsal views. ef, eye field; tel, telencephalon. Scale bars: 50 μm. EXPRESSION / LABELING:
|
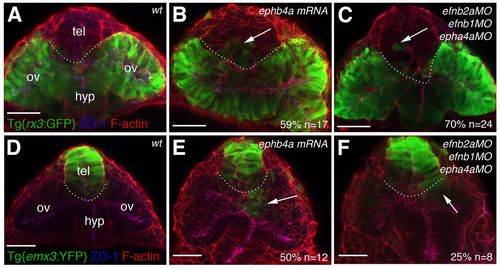
Manipulation of Eph/Ephrin activity leads to defective segregation of eye and telencephalic cells. Frontal views of the forebrain and eyes in Tg{rx3:GFP} (A-C) and Tg{emx3:YFP} (D-F) 10-12 ss wild-type, morphant or mRNA-injected zebrafish embryos immunostained to detect GFP (green), ZO-1 (blue) and F-actin (red). Arrows point at eye fated cells located in the telencephalic domain (B,C) or at telencephalic fated cells located in the optic vesicles (E,F). The dotted lines demarcate the transition between telencephalon and eye. ov, optic vesicle; tel, telencephalon; hyp, hypothalamus. Scale bars: 50 μm. EXPRESSION / LABELING:
PHENOTYPE:
|
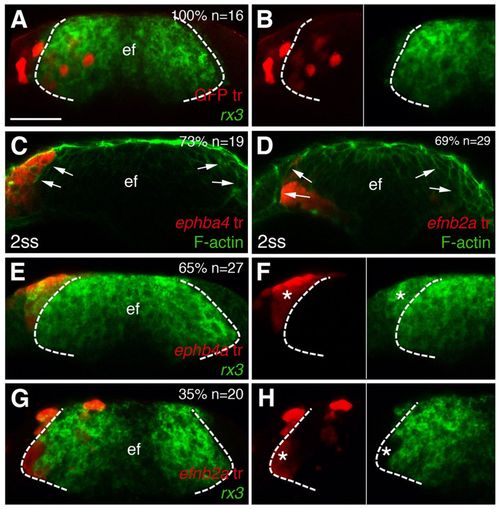
Eph/Ephrin expression influences the segregation of cells between ANP domains. (A-H) Frontal views through the forebrain showing transplants of cells expressing GFP (A,B), ephb4a (C,E,F) or efnb2a (D,G,H) at 1-2 ss, treated to detect rx3 expression in the eye field (A,B,E-H) or accumulation of F-actin at the eye/telencephalic boundary (C,D). Dashed lines (A,B,E-H) demarcate the eye field (ef); arrows (C,D) point at the boundary of the eye. Asterisks (F,H) highlight the transplanted cells. F and H show details from panels E and G, respectively. Scale bars: 50 μm. |
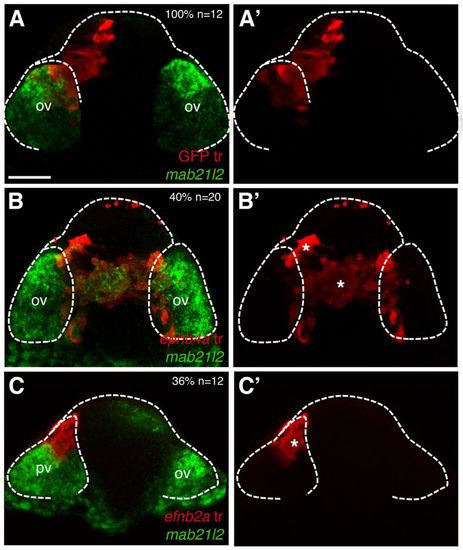
Cell segregation behaviour is independent of cell fate. Frontal views through the forebrain of transplants of cells expressing GFP (A,A′), ephb4a (B,B′) or efnb2a (C,C′) at 10-12 ss, subject to in situ hybridisation to detect mab21/2 in the optic vesicles (ov, green). Dashed lines demarcate the head and the optic vesicles. Asterisks (B′,C′) highlight the transplanted cells. Scale bars: 50 μm. |
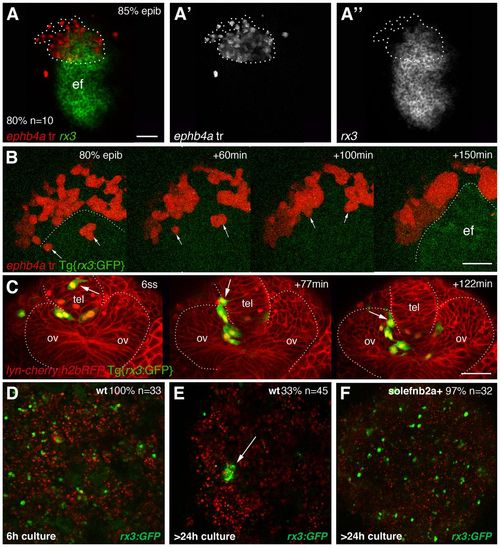
Eye field cells actively segregate from cells in surrounding tissues. (A-A′) Dorsal view of the ANP with anterior to the left, showing a transplant of cells expressing ephb4a (red) straddling the eye/telencephalon domain at 80/90% epiboly. (B) Snapshots of the ANP with anterior to the top taken from supplementary material Movie 2, showing ephb4a+ cells (red, arrows) as they move out from the prospective eye field [labelled by GFP (green) and outlined in the last frame]. (C) Snapshots of the evaginating optic vesicles from a frontal view taken from supplementary material Movie 3, showing an rx3:GFP+ cell mislocated in the telencephalon (arrow) as it relocates into the optic vesicle. The host embryo has been counterlabelled by a membrane-tagged form of cherry (red) and the transplanted cells have their nuclei labelled by H2bRFP (red). (D-F) Confocal images of hanging drop cultures of cells obtained from the dissociation of Tg{rx3:GFP} tailbud stage embryos, cultured for 6 hours (D) or more than 24 hours (E,F). Eye field cells from non-manipulated embryos aggregated in small clusters after long culture times (E, arrow), whereas overexpression of sol-efnb2a results in virtually no embryos forming eye field cell aggregates (F). ef, eye field; ov, optic vesicle. Scale bars: 50 μm. |

Eph/Ephrin manipulations do not perturb ANP patterning. |
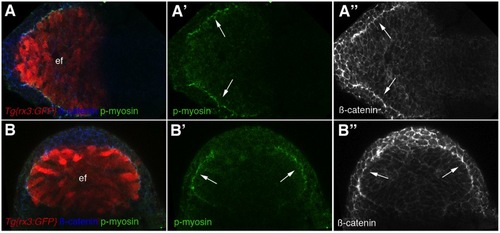
Phosphorylated light-chain-myosinII and β-catenin co-localise at the edge of the eye field. |

Telencephalic markers in eph/ephrin-expressing transplants. |