
- Title
-
Inter-individual and inter-strain variations in zebrafish locomotor ontogeny
- Authors
- Lange, M., Neuzeret, F., Fabreges, B., Froc, C., Bedu, S., Bally-Cuif, L., and Norton, W.H.
- Source
- Full text @ PLoS One
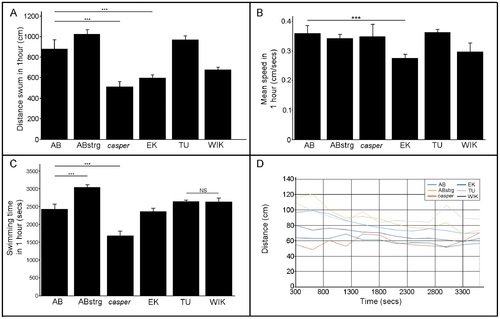
Locomotory behaviour of six zebrafish strains at 6 days post fertilisation. A) Mean distance swum in a 60-minute time interval by 6 day-old AB, ABstrg, casper, EK, TU and WIK larvae. casper, EK and WIK larvae swam significantly less than AB, ABstrg or TU. For the statistics refer to table 2. AB n = 47; ABstr n = 94; casper n = 47; EK n = 90; TU n = 47 and WIK n = 93. B) Mean swimming speed of 6 day-old AB, ABstrg, casper, EK, TU and WIK larvae during a 60-minute experiment. EK and WIK larvae swam significantly slower than the other fish strains. For the statistics refer to table 2. AB n = 47; ABstr n = 94; casper n = 47; EK n = 90; TU n = 47 and WIK n = 93. C) Mean time spent swimming during a 60-minute experiment for 6 day-old AB, ABstrg, casper, EK, TU and WIK larvae. ABstrg swam significantly more than all other fish strains. casper swam significantly less than all other fish strains. EK swam significantly less time than ABstrg, WIK and TU, and significantly more than casper. For the statistics refer to table 2. AB n = 47; ABstr n = 94; casper n = 47; EK n = 90; TU n = 47 and WIK n = 93. D) The distance swum every 5 minutes for each strain as function of time. Values are plotted every 300 seconds in a 60-minute experiment for 6 day-old AB, ABstrg, casper, EK, TU and WIK larvae. AB, ABstrg and EK fish show smoother locomotion curves than casper, TU and WIK. For the statistics refer to table 1. AB n = 47; ABstr n = 94; casper n = 47; EK n = 90; TU n = 47 and WIK n = 93. PHENOTYPE:
|

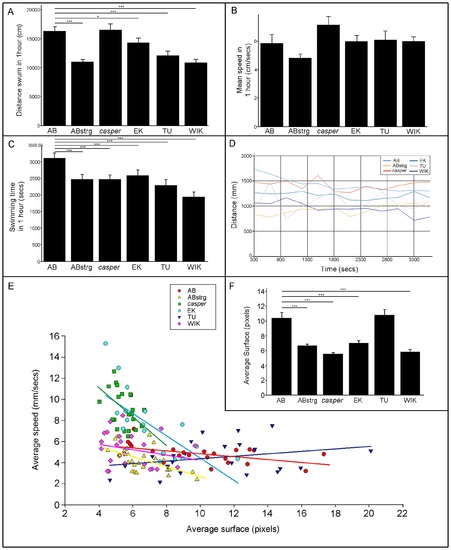
Locomotory behaviour of six zebrafish strains at one month post fertilisation. A) Mean distance swum in a 60-minute time interval by 1 month-old AB, ABstrg, casper, EK, TU and WIK juveniles. ABstrg swam significantly less than all other strains apart from casper. casper swam significantly less than EK, TU and WIK. For the statistics refer to table 2. AB n = 39; ABstrg n = 39; casper n = 37; EK n = 19; TU n = 39, WIK n = 27. B) Mean swimming speed of 1 month-old AB, ABstrg, casper, EK, TU and WIK juveniles during a 60-minute experiment. ABstrg swam significantly slower than the other fish strains. For the statistics refer to table 2. AB n = 39; ABstrg n = 39; casper n = 37; EK n = 19; TU n = 39, WIK n = 27. C) Mean time spent swimming during a 60-minute experiment for 1 month-old AB, ABstrg, casper, EK, TU and WIK juveniles. ABstrg, EK, TU and WIK swam for significantly more time than AB and casper. For the statistics refer to table 2. AB n = 39; ABstrg n = 39; casper n = 37; EK n = 19; TU n = 39, WIK n = 27. D) The distance swum every 5 minutes for each strain as function of time. Values are plotted every 300 seconds in a 60-minute experiment for 1 month-old AB, ABstrg, casper, EK, TU and WIK juveniles. AB, ABstrg, casper, EK and WIK fish show smoother locomotion curves than TU. For the statistics refer to table 1. AB n = 39; ABstrg n = 39; casper n = 37; EK n = 19; TU n = 39, WIK n = 27. E) Graph showing the correlation between fish size (measured by surface area) and swimming speed during a 60-minute experiment for one month old AB, ABstrg, casper, EK, TU and WIK juveniles. There is no correlation between size of fish and swimming speed for any strain analysed. We calculated the Pearson product-moment coefficient for each strain (r) with speed as independent variable and surface as dependant variable. AB r = 0.23 NS; ABstrg r = -0.28 NS; casper r = 0.07 NS; EK r = -0.12 NS; TU r = 0.17 NS; WIK r = 0.3 *p = 0.05. AB n = 29; ABstrg n = 39; casper n = 32; EK n = 19; TU n = 38, WIK n = 26. F) Relative size of 1 month-old juvenile fish, calculated by measuring the average number of pixels making up their surface area. casper mutant fish have a significantly smaller surface area than AB, ABstrg, EK, TU and WIK. Student′s t-test: AB vs ABstrg NS; AB vs casper ***p<0.001; AB vs EK NS; AB vs TU NS; AB vs Wik *p<0.05; ABstrg vs casper ***p<0.001; ABstrg vs EK NS; ABstrg vs TU NS; ABstrg vs WIK NS; casper vs EK ***p<0.001; casper vs TU ***p<0.001; casper vs WIK ***p<0.001; EK vs TU NS; EK vs WIK NS; TU vs WIK NS. PHENOTYPE:
|
Locomotion profiles of six zebrafish strains at three months post fertilisation. A) Mean distance swum in a 60-minute time interval by 3 month-old AB, ABstrg, casper, EK, TU and WIK adults. ABstrg, TU and WIK swam significantly less than AB, casper and EK. For the statistics refer to table 2. AB n = 19; ABstrg n = 22; casper n = 21; EK n = 18; TU n = 23, WIK n = 23. B) Mean swimming speed of 3 month-old AB, ABstrg, casper, EK, TU and WIK adults during a 60-minute experiment. ABstrg swam significantly slower than the other fish strains. For the statistics refer to table 2. AB n = 19; ABstrg n = 22; casper n = 21; EK n = 18; TU n = 23, WIK n = 23. C) Mean time spent swimming during a 60-minute experiment for 3 month-old AB, ABstrg, casper, EK, TU and WIK adults. ABstrg, casper, EK, TU and WIK swam significantly less time than AB. For the statistics refer to table 2. AB n = 19; ABstrg n = 22; casper n = 21; EK n = 18; TU n = 23, WIK n = 23. D) The distance swum every 5 minutes for each strain as function of time. Values are plotted every 300 seconds in a 60-minute experiment for 3 month-old AB, ABstrg, casper, EK, TU and WIK adults. AB, ABstrg, casper and WIK fish show smoother locomotion curves than EK and TU. For the statistics refer to table 1. AB n = 19; ABstrg n = 22; casper n = 21; EK n = 18; TU n = 23, WIK n = 23. E) Graph showing the correlation between fish size (measured by surface area) and swimming speed during a 60-minute experiment for 3 month-old AB, ABstrg, casper, EK and TU adults. At this age there appears to be a correlation between size of fish and swimming speed for ABstrg, casper and WIK. Similar to our analysis at 1 month, we determined the Pearson product-moment coefficient for each strain (r) with speed as the independent variable and surface as dependant variable to investigate surface and speed. AB r = -0.57 **p<0.025: NS; ABstrg r = -0.54 **p<0.025; casper r = -0.39 *p<0.05; EK r = -0.68 ***p<0.001; TU r = 0.28 NS; WIK r = -0.23 NS. AB n = 24; ABstrg n = 24; casper n = 24; EK n = 18; TU n = 23, WIK n = 23. F) Relative size of 3 month-old adult fish calculated by measuring the average number of pixels making up their surface area. ABstrg, casper, EK and WIK adults have a significantly smaller surface area than AB and TU. Student′s t-test: AB vs ABstrg ***p<0.001; AB vs casper ***p<0.001; AB vs EK ***p<0.001; AB vs TU NS; AB vs Wik ***p<0.001; ABstrg vs casper ***p<0.001; ABstrg vs EK NS; ABstrg vs TU ***p<0.001; ABstrg vs WIK NS; casper vs EK **p<0.025; casper vs TU ***p<0.001; casper vs WIK NS; EK vs TU ***p<0.001; EK vs WIK P *p<0.05; TU vs WIK ***p<0.001. PHENOTYPE:
|