
- Title
-
Epidermal keratinocyte polarity and motility require Ca2+ influx through TRPV1
- Authors
- Graham, D.M., Huang, L., Robinson, K.R., and Messerli, M.A.
- Source
- Full text @ J. Cell Sci.
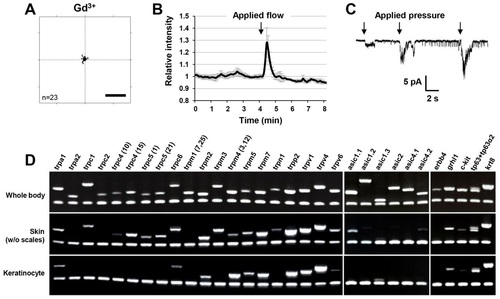
Ca2+ influx occurs predominantly through mechanosensitive channels. (A) xy-trajectory plot of cells exposed to 10µM Gd3+ for 1hour. Scale bar: 200µm. (B) Graph from transient shear stress applied to keratinocyte sheets indicates a transient increase in whole-cell [Ca2+]i during application of fluid flow (n = 3 cell sheets). (C) Whole-cell voltage clamp recording of a migrating keratinocyte in fish Ringer′s solution. Three times gentle pressure was applied to the patch pipette, increasing the probability of mechanosensitive channels to be in the open state. Spontaneously activated channels are open briefly. (D) Tissue-specific gene expression analysis from adult zebrafish keratinocytes of two ion channel families containing mechanosensitive Ca2+-permeable channels. Genes found at multiple loci were amplified at consensus regions, with the exception of trpc4 and trpc5 that were analyzed separately. The chromosome number is given for genes that were found at multiple loci. Loading control is β-actin. EXPRESSION / LABELING:
|
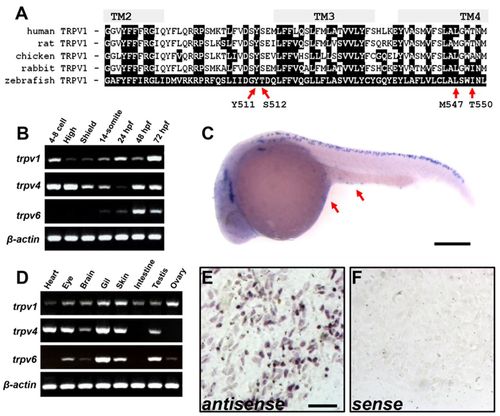
Zebrafish TRPV1 is expressed in the epidermal epithelium. (A) Sequence alignment of TRPV1 proteins from different species comparing the critical residues for vanilloid activation. Defined transmembrane regions (TM) are based on the predicted membrane topology of zebrafish TRPV1. Red arrows indicate residues important for capsaicin sensitivity and are listed according to the residue positions of rat TRPV1. (B) Gene expression of TRPV members during different stages of development. (C) In situ hybridization for trpv1 in an embryo 24hours post fertilization (hpf). Arrows indicate staining in the epidermal epithelium. Scale bar: 250μm. (D) Tissue-specific gene expression of TRPV members. (E,F) In situ hybridization of the motile fraction of an explant of adult epidermal epithelia for trpv1 using antisense- and sense RNA probes. Scale bar: 50 μm. |